Top 3 Price Prediction Bitcoin, Ethereum, Ripple: Bitcoin struggles around $64,000 level
- Bitcoin price encounters resistance around the $64,000 daily resistance level.
- Ethereum price experiences rejection as it meets the descending trendline around the $3,500 level.
- Ripple price faces resistance at $0.500, its daily resistance level.

Bitcoin (BTC) faces resistance near the $64,000 daily level, leading to a 1.05% decline in trading on Wednesday. Ethereum (ETH) and Ripple (XRP) similarly encounter resistance, resulting in 1% and 0.5% declines, respectively.
Bitcoin price finds hurdle around the $64,000 level
Bitcoin price was rejected by the daily resistance level at $63,956 on Monday and trades down 1.05% at $61,488 on Wednesday.
If BTC's price closes above the hurdle at the $63,956 daily resistance level, it could rise 5% to retest its next weekly resistance at $67,147.
The Relative Strength Index (RSI) and the Awesome Oscillator in the daily chart are below their neutral levels of 50 and zero. If bulls are indeed returning, then both momentum indicators must regain their positions above their respective neutral levels.
If the bulls are aggressive and the overall crypto market outlook is positive, BTC could extend an additional rally of 6% to revisit its weekly resistance at $71,280.
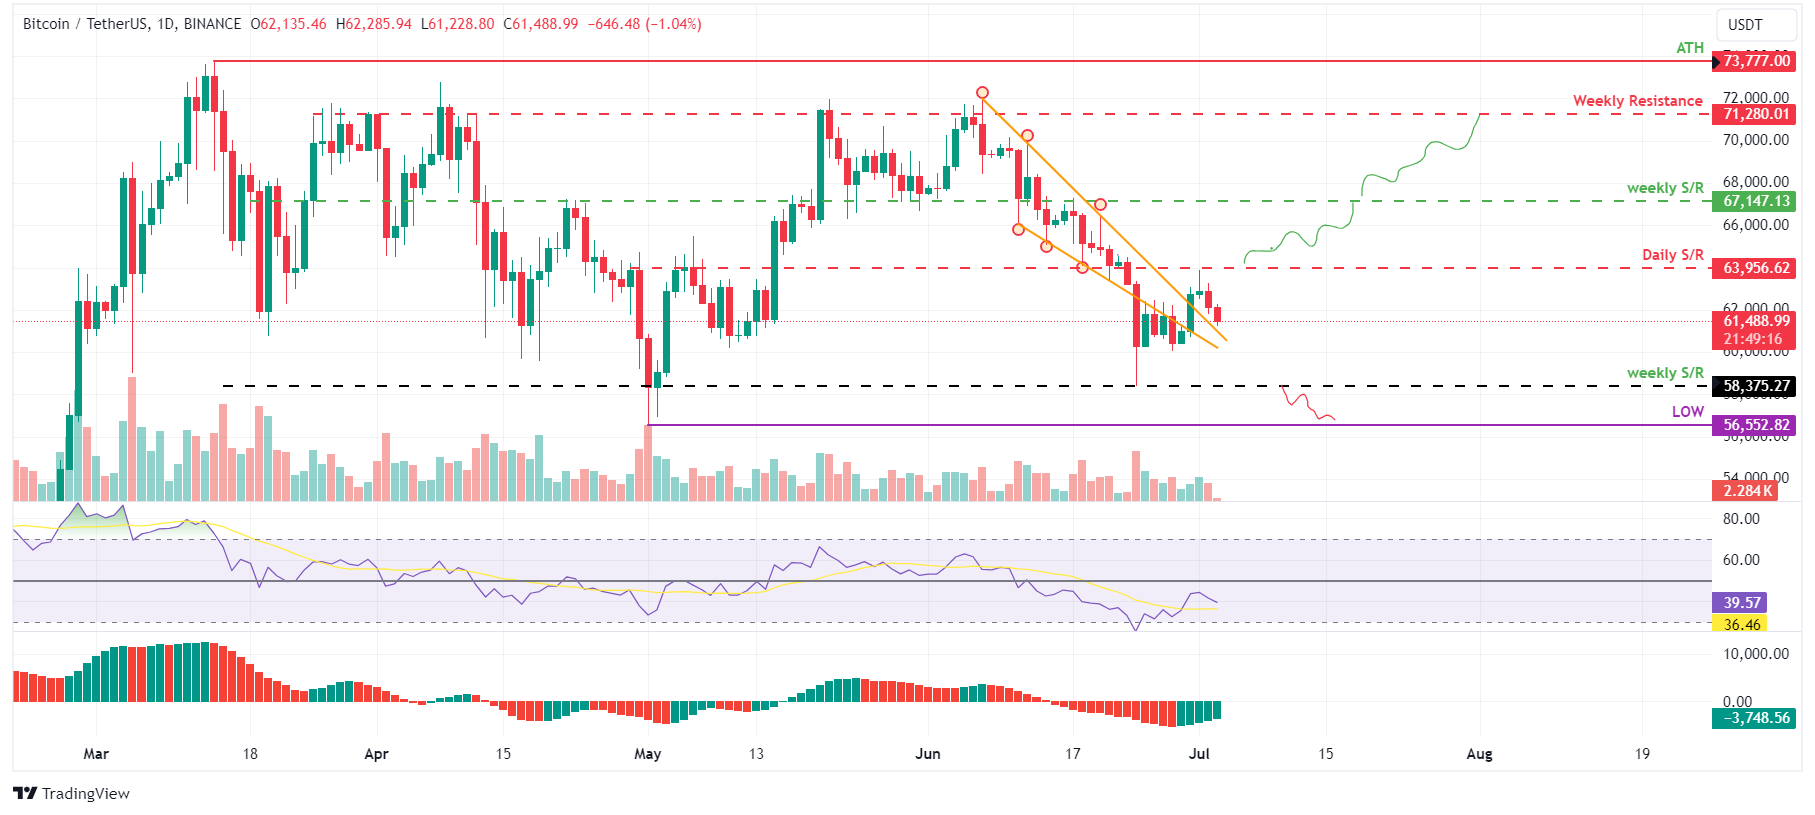
BTC/USDT daily chart
However, if BTC closes below the $58,375 level and forms a lower low in the daily time frame, it could indicate that bearish sentiment persists. Such a development may trigger a 3% decline in Bitcoin's price, to revisit its low of $56,522 from May 1.
Ethereum price experiences rejection by the descending trendline
Ethereum price was rejected by the descending trendline on Monday and is now 1% lower on Wednesday, reaching $3,386. This descending trendline is drawn from joining multiple swing highs from June 9 to July 1.
If ETH breaks above the descending trendline around the $3,500 level, it could rise 5.5% from the breakout point to tag its previous high of $3,717 on June 9.
The Relative Strength Index (RSI) and the Awesome Oscillator in the daily chart are below their neutral levels of 50 and zero. If bulls are indeed returning, then both momentum indicators must maintain their positions above their respective neutral levels.
If ETH closes above $3,717, the high of June 9, it could extend an additional rally of 7% to reach its previous resistance level of $3,977.
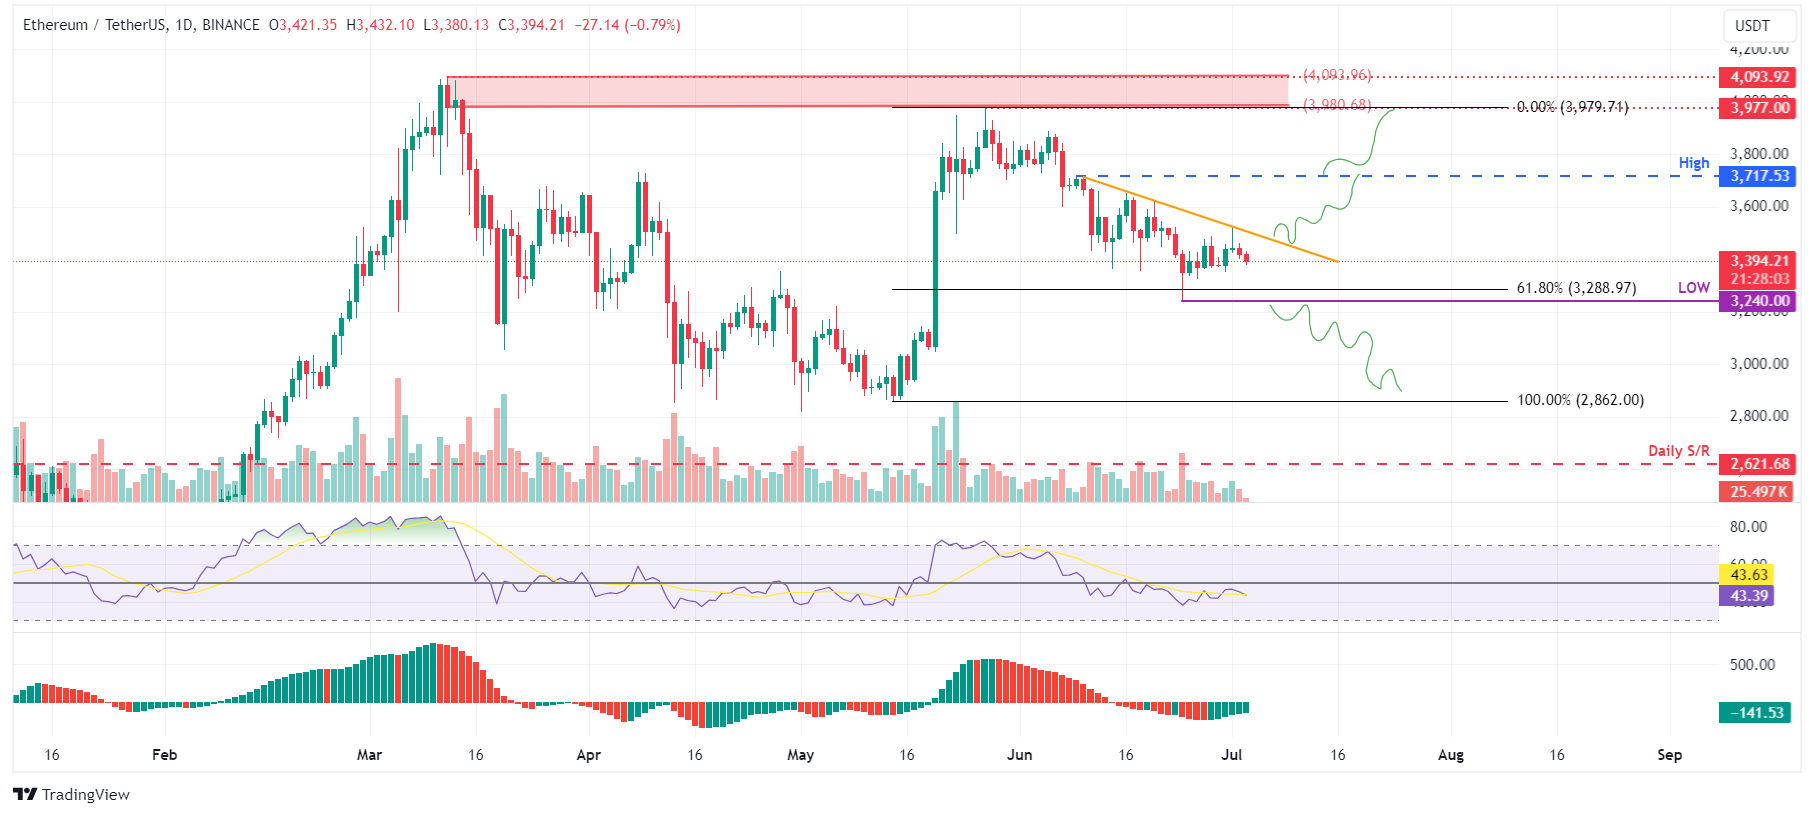
ETH/USDT daily chart
On the other hand, if Ethereum's daily candlestick closes below the $3,240 level, it would produce a lower low and signal a break in the market structure. This move would invalidate the aforementioned bullish thesis, potentially triggering an extra 12% crash to the previous support level of $2,862.
Ripple price struggles at the $0.50 level
Ripple price currently trades at $0.483, below the daily resistance level of $0.50.If Ripple's price surpasses the barrier at $0.50, it could rise 7% from $0.50 to $0.532, its previous high from June 5.
In the daily chart, the Relative Strength Index (RSI) is currently below the 50 mark, indicating neutral to bearish sentiment, while the Awesome Oscillator (AO) remains below zero, suggesting bearish momentum. Both indicators must rise above their critical thresholds of 50 for RSI and zero for AO for a sustained bullish trend. Such a development would bolster the ongoing recovery rally in the market.
If the XRP daily candlestick closes above $0.532, it could extend an additional 9% rally to $0.581, a 50% price retracement level of $0.419 and $0.744 from March 11 to April 13.
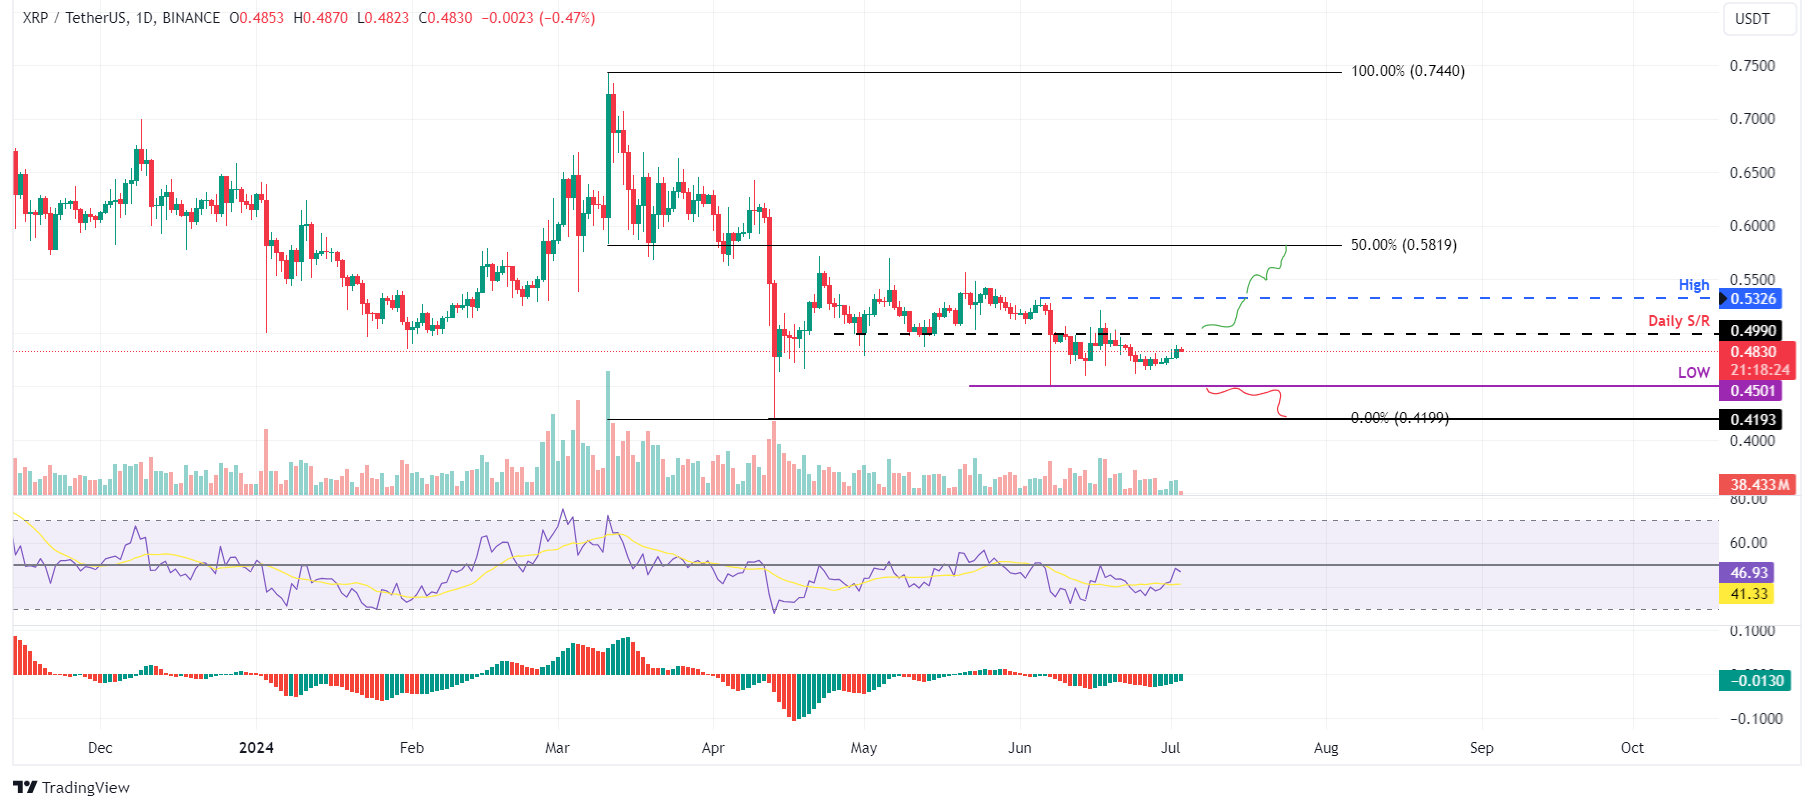
XRP/USDT daily chart
Conversely, if Ripple price daily candlestick closes below $0.450, marking the June 7 low, it would invalidate the bullish outlook by establishing a lower low on the daily chart. This scenario might lead to a 7% decline in XRP's price towards the April 13 low of $0.419.
Author

Manish Chhetri
FXStreet
Manish Chhetri is a crypto specialist with over four years of experience in the cryptocurrency industry.


