Top 3 Price Prediction Bitcoin, Ethereum, Ripple: Bitcoin keeps a winning card on hand
- Bitcoin's chart leaves the door open to reaching new relative highs.
- Ethereum is still in a downward spiral and is losing market share to Bitcoin.
- Extreme market optimism remains a risk as a correction may come.

The crypto board has chosen the upside on Monday while continuing to consolidate all the gains since March.
The weakness that emerged at the beginning of last week has failed – so far – to break through the top 3’s support lines.
Bitcoin, Ethereum and Ripple are still within the price ranges of recent highs, and despite the current weakness, they remain within the previous bullish scenario.
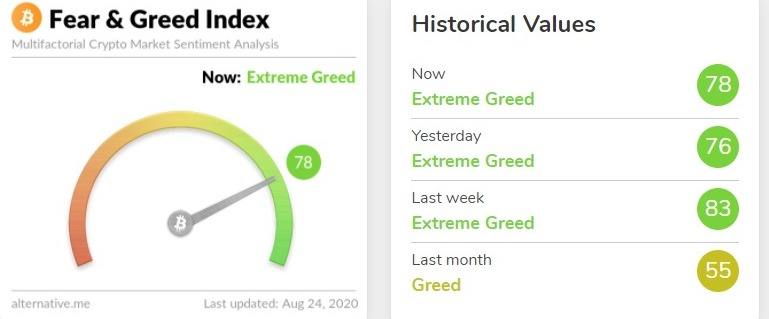
Source: alternative.me
The market sentiment level continues to show a euphoric market. The indicator is around 78 and resists moving towards levels more conducive to healthy price development in the short term.
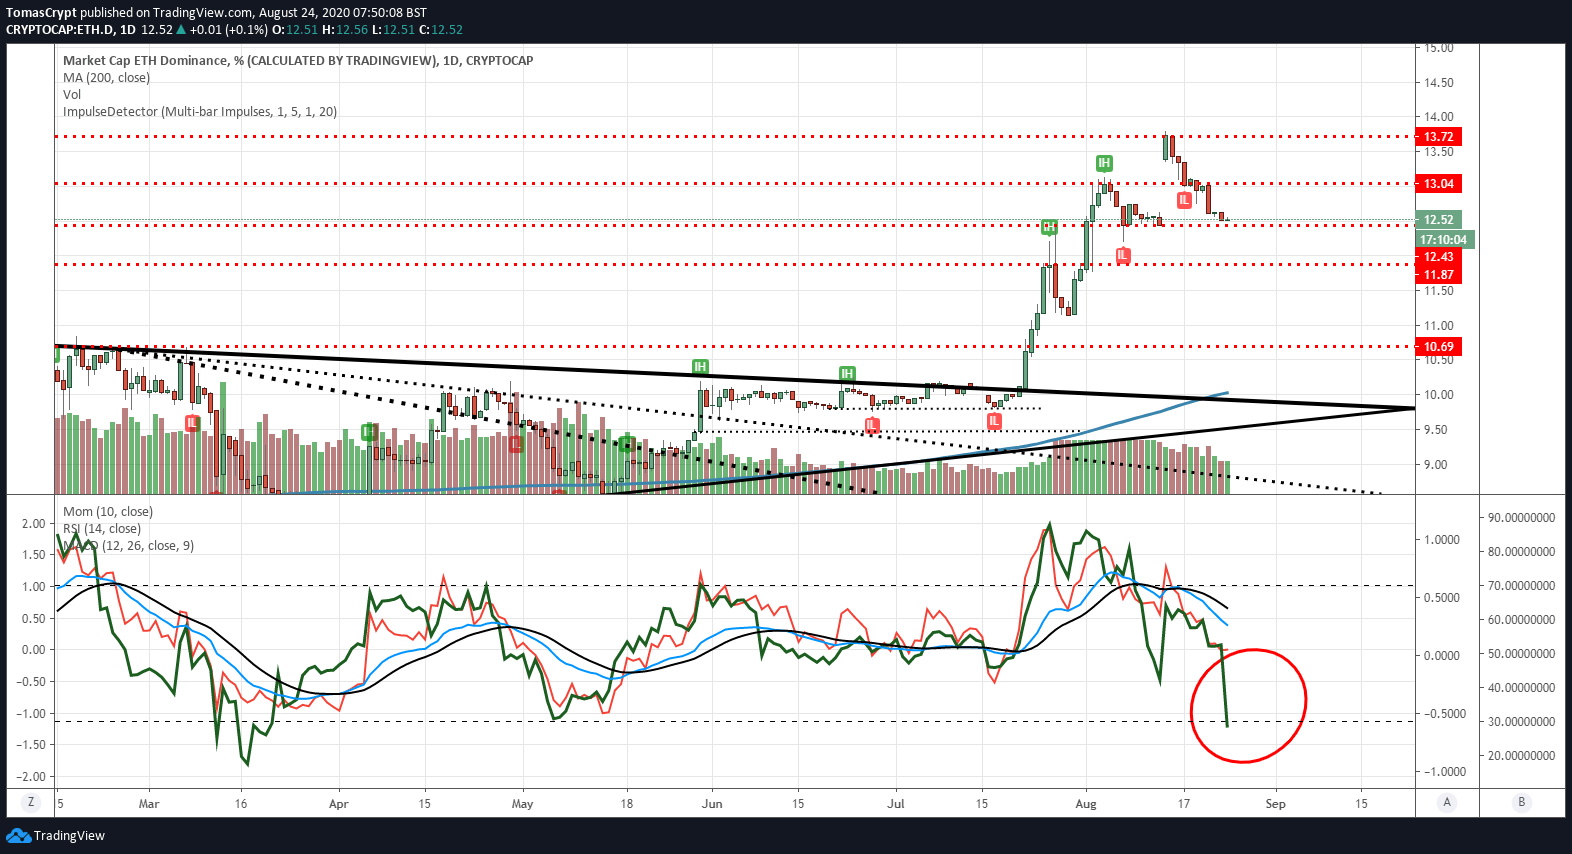
The war for market share remains active, putting pressure on Ethereum in particular. The momentum of Ether's dominance chart is moving to a bearish extreme that could lead to a rapid rebound in the short term. In the medium term, the scenario remains bearish.
ETH/BTC Daily Chart
ETH/BTC is currently trading at 0.03385 and momentarily finds support at the price congestion level of 0.0332. The 50-day exponential moving average is at around 0.0315, marking a possible target level in the short term.
Above the current price, the first resistance level is at 0.035, then the second at 0.0368 and the third one at 0.0372.
Below the current price, the first support level is at 0.0332, then the second at 0.0316 and the third one at 0.030.
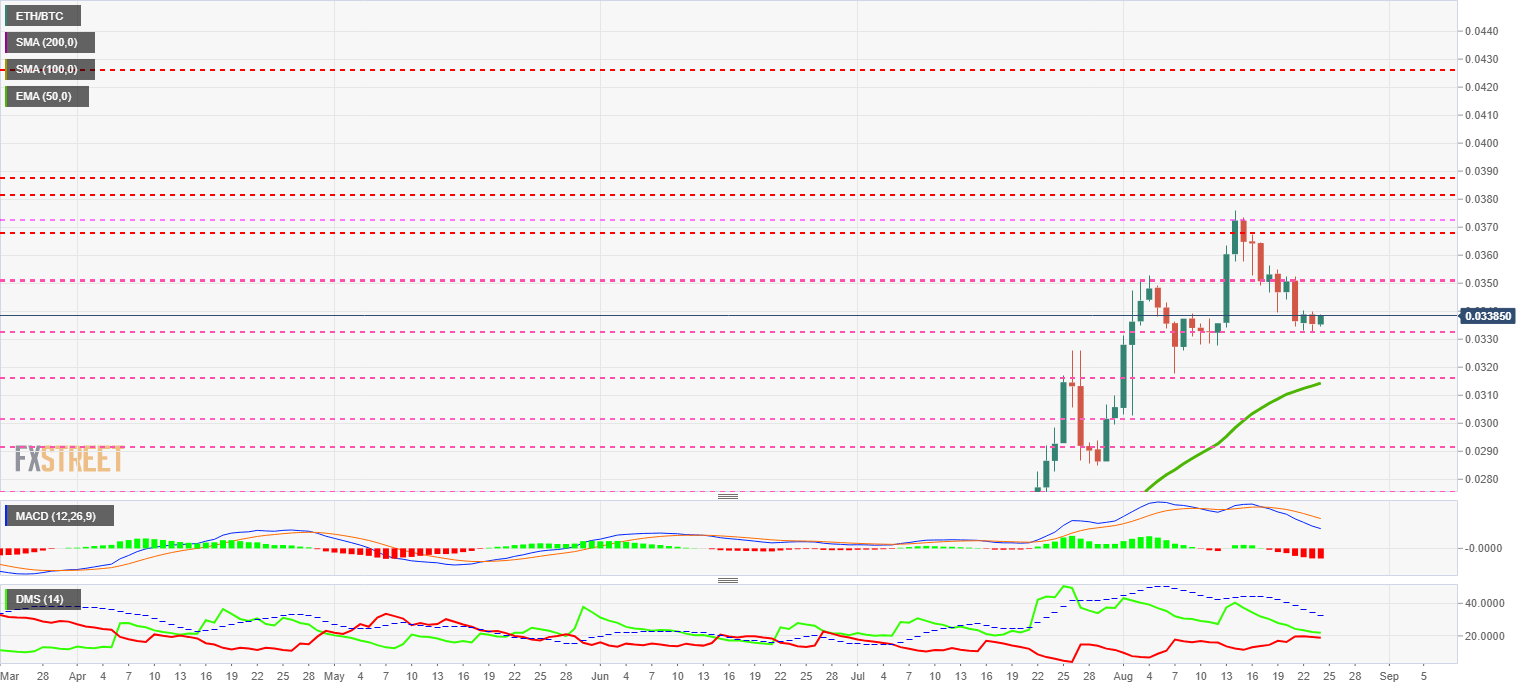
The MACD on the daily chart continues to develop a bearish cross but is losing some of its downward momentum. The separation between the moving averages is huge, so the consolidation movement still has some way to go.
The DMI on the daily chart shows bulls and bears moving very close together. Any downward movement in the price would give the leadership of the ETH/BTC pair to the bears.
BTC/USD Daily Chart
BTC/USD is currently trading at $11,771 and is moving upwards, taking advantage of a positive day in the crypto market. The chances of breaking a relative high in a consolidation environment are low.
Above the current price, the first resistance level is at $12,275, then the second at $14,000 and the third one at $17,200.
Below the current price, the first support level is at $11,250, then the second at $10,935 and the third one at $10,650.
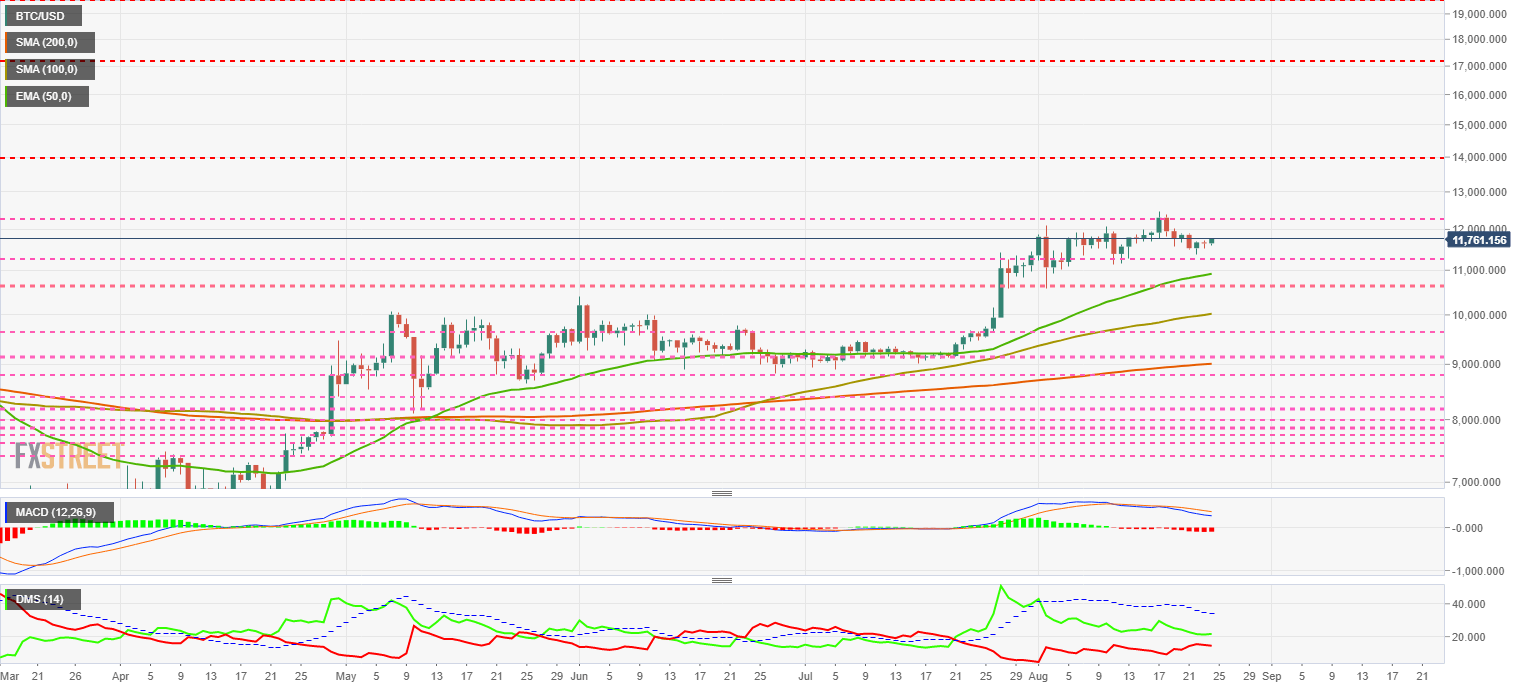
The MACD on the daily chart is losing its bearish profile and is approaching a favorable position for a new bullish cross in the near term.
The DMI indicator on the daily chart shows the bulls moving away from the bears again without the sell-side having attempted to take control of the pair.
ETH/USD Daily Chart
ETH/USD is currently trading at the price level of $393.8 while moving in the lower part of the current price range. The 50-day exponential moving average is moving in the $350 range, a feasible short term target.
Above the current price, the first resistance level is at $420, then the second at $440 and the third one at $460.
Below the current price, the first support level is at $385, then the second at $350 and the third one at $315.
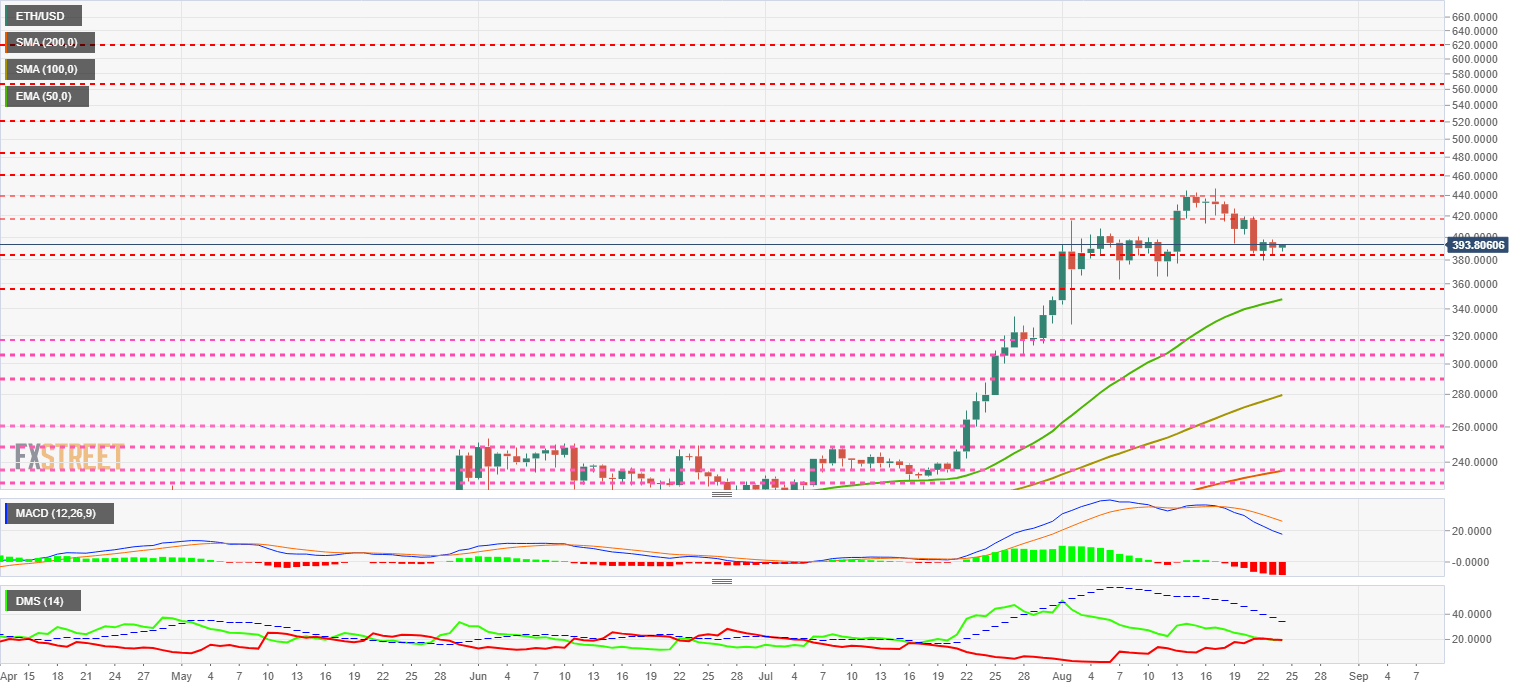
The MACD on the daily chart shows an acceleration of the downward trend, with the moving averages further apart and a small increase in the downward slope.
The DMI on the daily chart shows both sides of the market moving at the same level, waiting for a final move in the price to indicate whether it will be the bulls or the bears that take the lead in the short term.
XRP/USD Daily Chart
XRP/USD is currently trading at $0.2887 and is attempting to break the price congestion resistance level at $0.29 to return to the middle of the consolidation range.
Above the current price, the first resistance level is at $0.29, then the second at $0.30 and the third one at $0.315.
Below the current price, the first support level is at $0.285, then the second at $0.267 and the third one at $0.26.
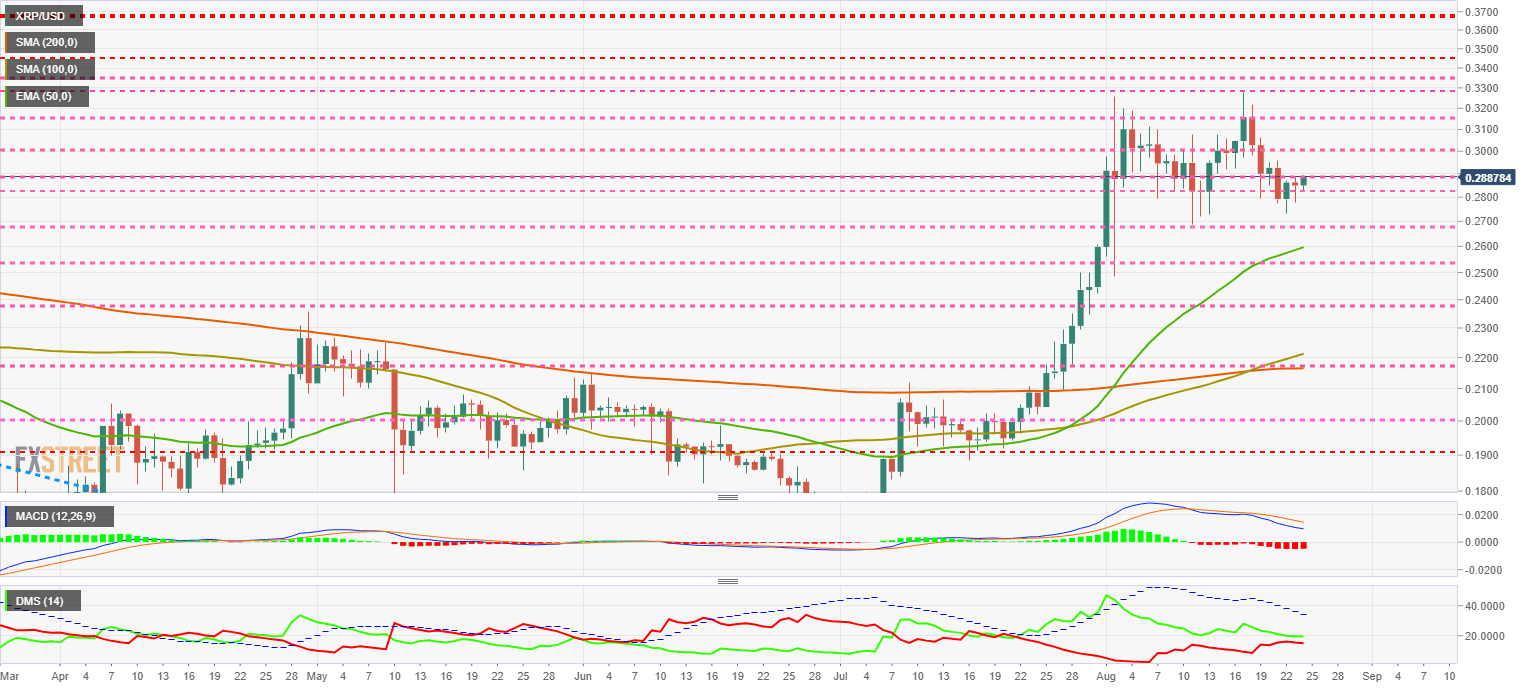
The MACD on the daily chart continues to cross downward and increases the gap between the moving averages. The bearish profile is decreasing a bit but not enough to attempt a significant upward move.
The DMI on the daily chart shows the bears and bulls following closely together. A downward movement in the price would allow the selling side to take control of the pair.
Author

Tomas Salles
FXStreet
Tomàs Sallés was born in Barcelona in 1972, he is a certified technical analyst after having completing specialized courses in Spain and Switzerland. He expanded his technical training following the guidance of great experts on the financial markets.


