Top 3 Price Prediction Bitcoin, Ethereum, Ripple: Bitcoin finds support around the $67,000 level
- Bitcoin price finds support around the weekly level of $67,209, signaling a potential bullish trend.
- Ethereum price faces rejection at $3,530; a close above it would indicate a bullish move.
- Ripple price finds support around the daily support level at $0.544, with an impending rally eyed.

Bitcoin (BTC) and Ripple (XRP) prices are holding steady around their respective weekly and daily support levels, hinting at an imminent rally. Meanwhile, Ethereum (ETH) is encountering resistance at the $3,530 mark; a decisive close above this level would signal a bullish breakthrough.
Bitcoin price shows potential for a rally ahead
Bitcoin price surpassed the weekly support at $67,209 on Sunday, and support was found around it on Monday. As of Tuesday, it is trading slightly up by 0.1% at $67,564.
If this weekly support at $67,209 holds, BTC could rally 7% to retest its daily high of $71,997, set on June 7.
On the daily chart, the Relative Strength Index (RSI) and the Awesome Oscillator (AO) are trading above their respective neutral levels of 50 and zero, respectively. This robust momentum signals a strong bullish sentiment in the market.
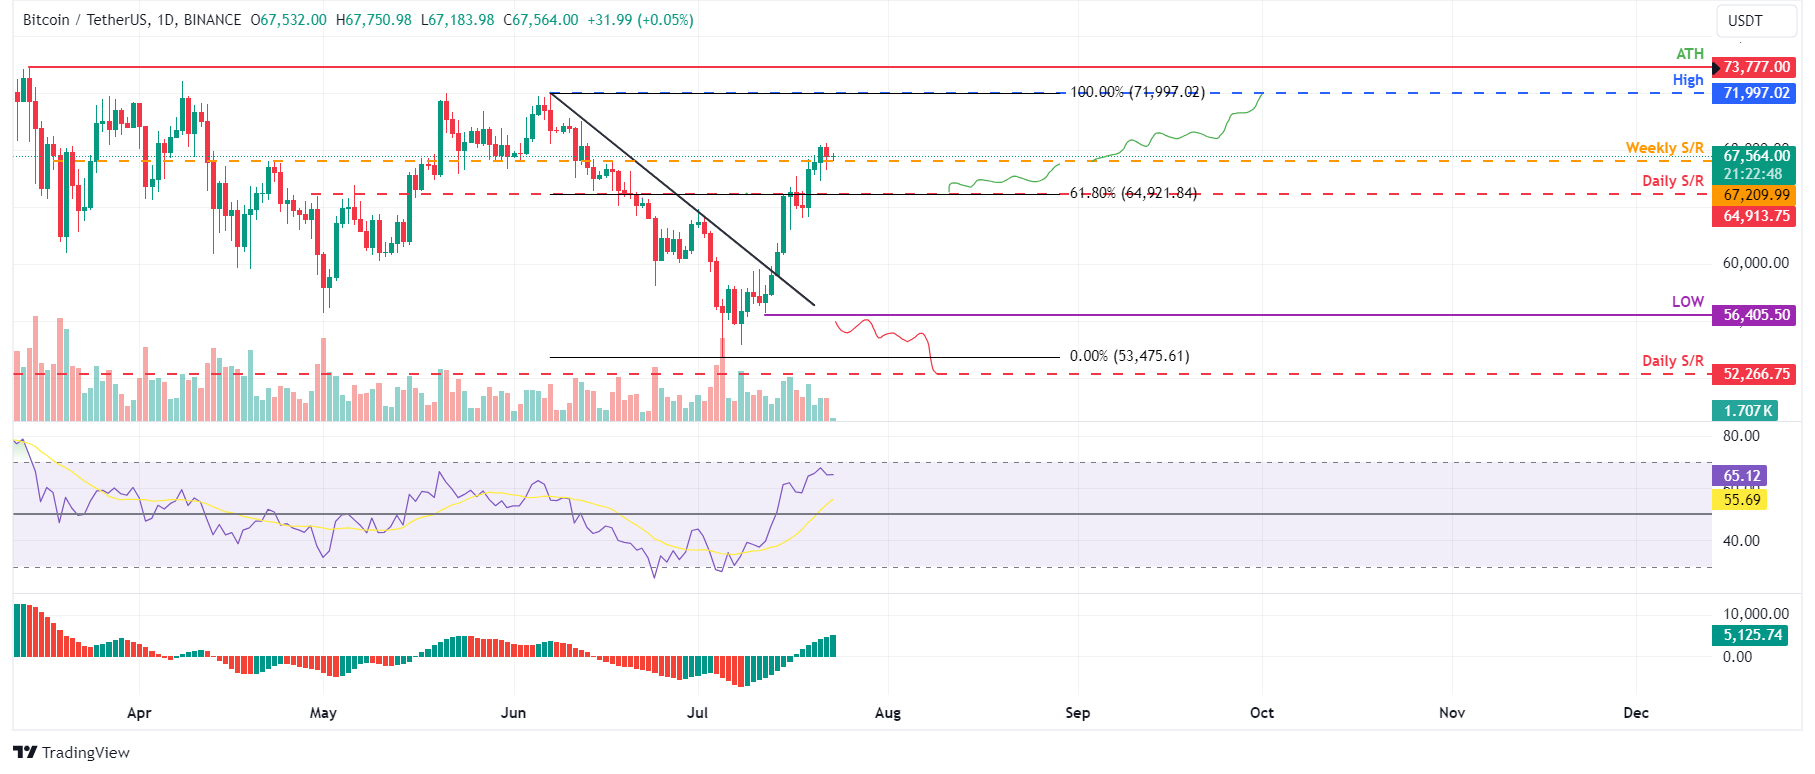
BTC/USDT daily chart
However, a close below $56,405 for BTC, accompanied by a formation of a lower low on the daily timeframe, could indicate sustained bearish sentiment. Such a scenario might precipitate a 7.5% decline in Bitcoin's price, potentially leading to a retest of its daily support level at $52,266.
Ethereum price poised for a rally following a break above $3,530 level
Ethereum price is encountering resistance at $3,530, corresponding to the 61.8% Fibonacci retracement level calculated between the swing high of $3,977 on May 27 and the swing low of $2,808 on July 5. This level closely matches the daily peak of $3,524 observed on July 1, forming a crucial resistance zone to watch closely. As of Tuesday, Ethereum is trading with a slight increase of 1.32%, reaching $3,482.
If Ethereum maintains support at the $3,240 level, where the former trendline resistance, now acting as a supportive barrier, holds firm, ETH could increase by 8.6% to retest its daily peak of $3,524, recorded on July 1.
This bounce is supported by indicators like the Relative Strength Index (RSI) and Awesome Oscillator (AO) on the daily chart, both comfortably above their respective mean levels of 50 and 0. These momentum indicators strongly indicate bullish dominance.
If bullish sentiment prevails and the overall cryptocurrency market outlook remains optimistic, Ethereum price could close above the $3,524 mark, potentially continuing its rally by 5.3% to challenge its June 9 daily peak of $3,721.
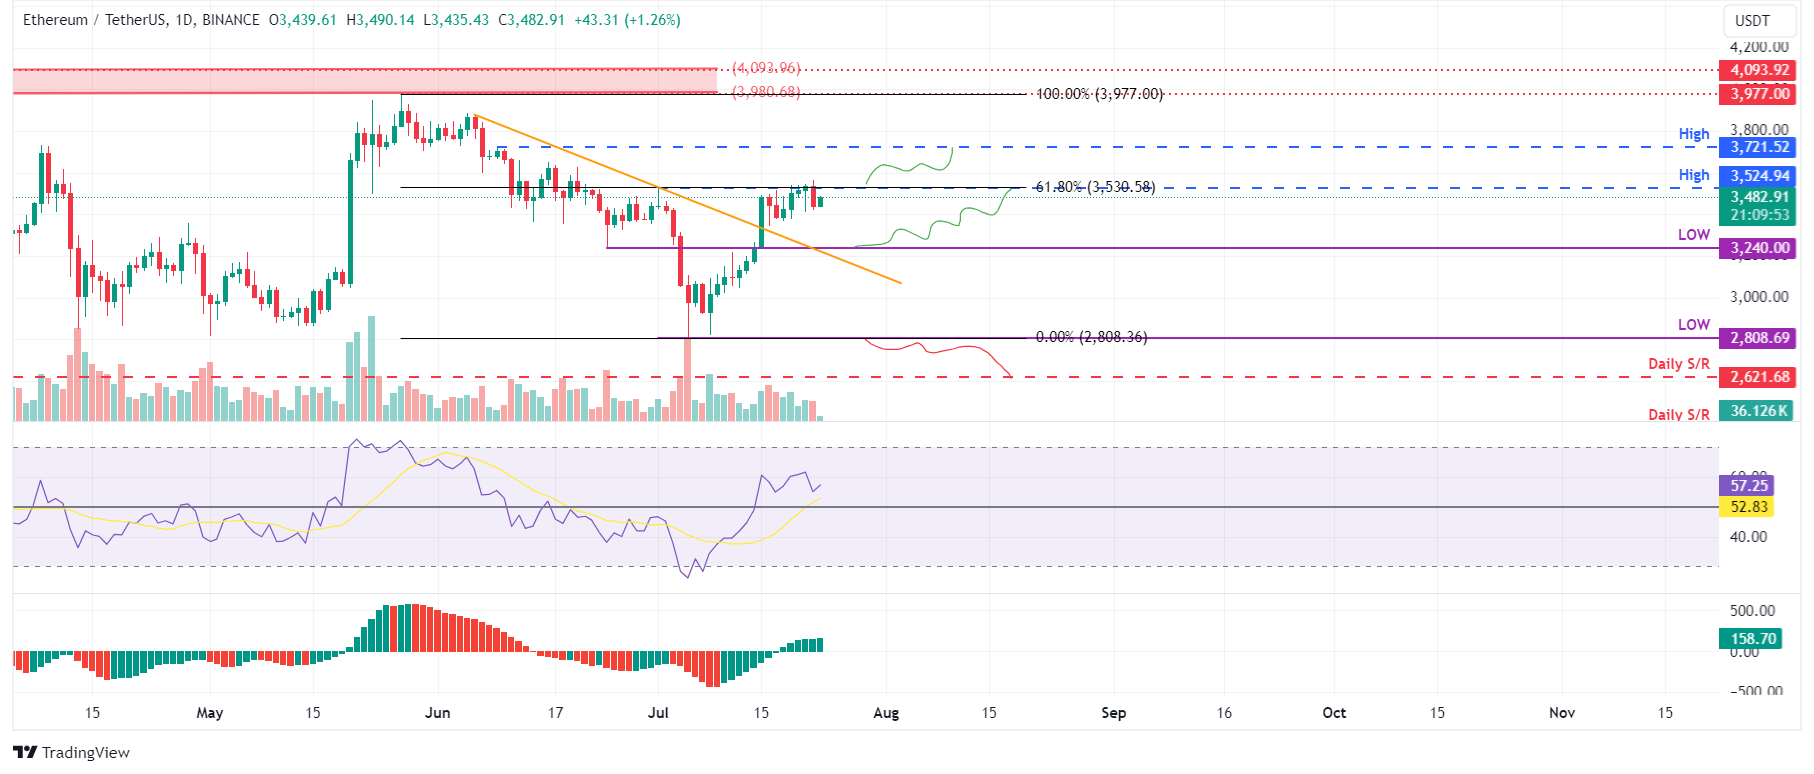
ETH/USDT daily chart
On the other hand, if Ethereum's daily candlestick closes below $2,817, forming a lower low in the daily timeframe, it may signal persistent bearish sentiment. This scenario could trigger a 7% decline in Ethereum's price, targeting a revisit of its daily support at $2,621.
Ripple price eyes a rally following a close above $0.643 mark
Ripple price faced rejection at around $0.643 on July 17 and crashed 8.8% the next two days.XRP retested its daily support at $0.544 and rallied 6% in the next three days. As of Tuesday, it trades slightly higher, 0.44%, reaching $0.610.
If XRP closes above the $0.643 level, it could rally 13.3% to retest its next daily resistance level at $0.724.
On the daily chart, the Relative Strength Index (RSI) and the Awesome Oscillator (AO) are currently above their neutral levels of 50 and zero, respectively. These momentum indicators strongly indicate bullish dominance.
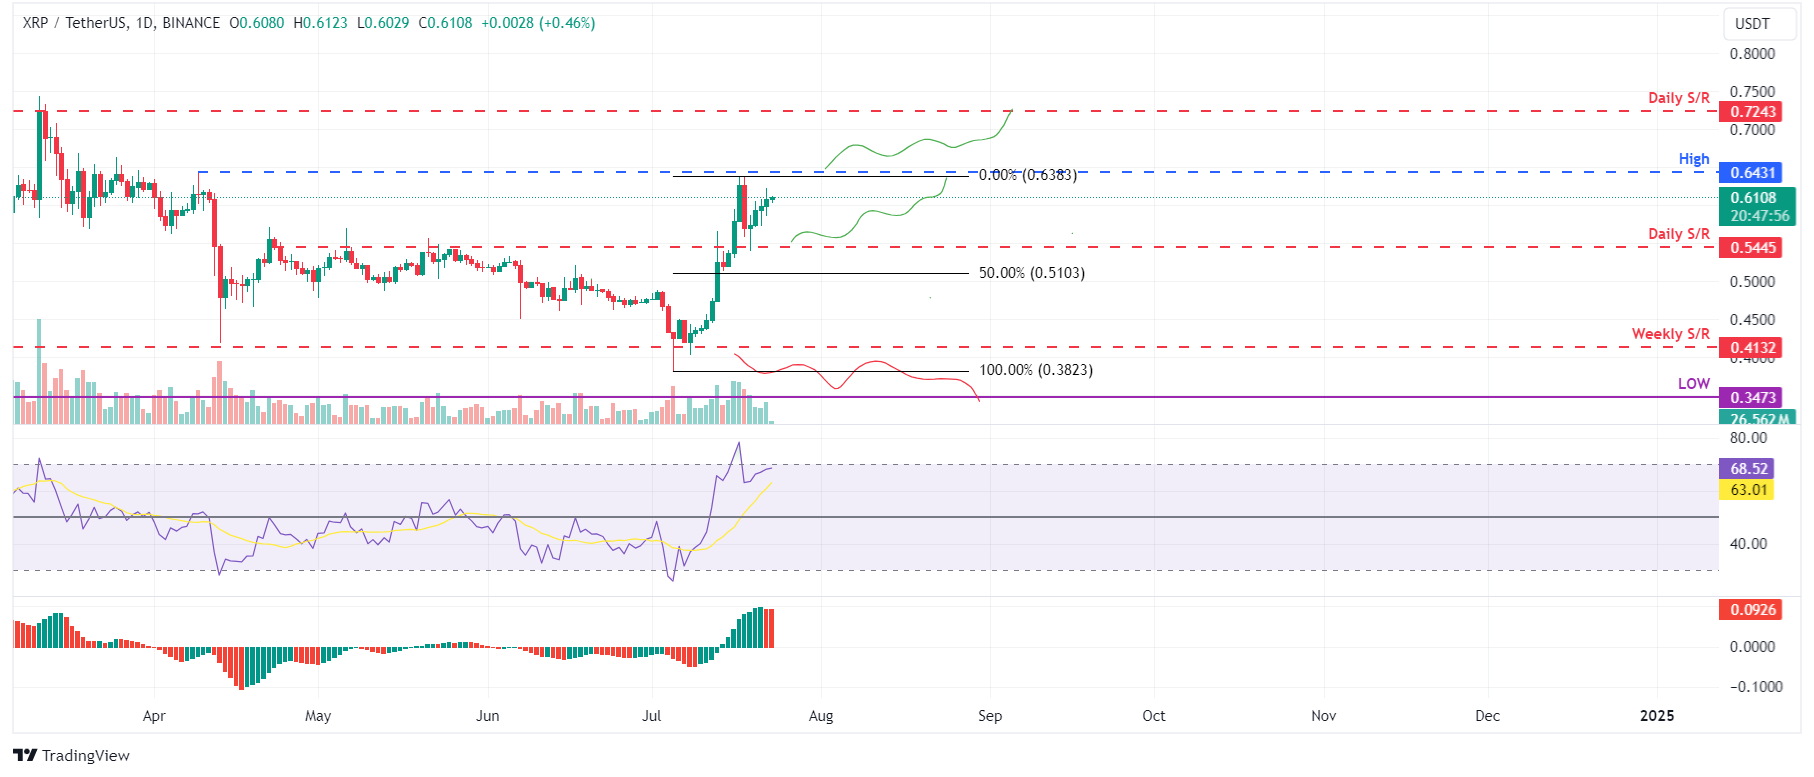
XRP/USDT daily chart
However, if Ripple's daily candlestick closes below $0.413, it indicates sustained bearish sentiment, forming a lower low in the daily timeframe. Such a scenario could lead to a 16% decline in Ripple's price, targeting a revisit of its low from March 12 at $0.347.
Author

Manish Chhetri
FXStreet
Manish Chhetri is a crypto specialist with over four years of experience in the cryptocurrency industry.


