Bitcoin Weekly Forecast: Will BTC continue its bullish momentum?
- Billionaire investor Mark Cuban discussed on Twitter on Wednesday Silicon Valley's growing support for former President Trump.
- U.S. spot Bitcoin ETFs saw their fourth straight day of inflows on Thursday, totaling $84.80 million.
- On-chain data shows that BTC is experiencing ‘overselling’ conditions, signaling a potential market bottom.

Bitcoin (BTC) price increased by 5.5% this week until Friday after breaking above a descending trendline. Currently, it is trading slightly higher by 0.23% at $64,166. By Thursday of this week, U.S. spot Bitcoin ETFs observed cumulative positive inflows totaling $861.50 million. On-chain data indicates oversold conditions for BTC, suggesting a possible market bottom.
Billionaire investor Mark Cuban tweets about Bitcoin
Billionaire investor Mark Cuban took to Twitter on Wednesday to discuss Silicon Valley's increasing support for former President Trump, describing it as a strategic "bitcoin play."
Cuban said, "Not because the former President is a far stronger proponent of crypto. That's nice. But doesn't really impact the price of crypto. It makes it easier to operate a crypto business because of the inevitable, and required, changes at the SEC."
He emphasized that BTC's price movement hinges more significantly on factors like lower tax rates and inflationary pressures from global uncertainty around the U.S. Dollar's reserve status.
In the second part of the tweet, Cuban explained how high Bitcoin price can go as its supply is limited to 21 million coins, with unlimited fractionalization. He added, "Keep that in mind as you consider what happens if, because of geopolitical uncertainty and the decline of the dollar as the reserve currency, BTC becomes a "safe haven" globally. Which means that BTC could be what countries and all of us look to buy as a means to protect our savings".
While cautious about making definitive predictions, Cuban acknowledged the possibility that Bitcoin could gain broader adoption, aligning with the ambitions of its strongest supporters.
Part 1
— Mark Cuban (@mcuban) July 17, 2024
Here is a contrary opinion on the emergence of Silicon Valley support for former President Trump. Which like all my opinions on here, probably won’t be popular.
It’s a bitcoin play.
Not because the former President is a far stronger proponent of crypto. That’s nice.…
Bitcoin Spot ETFs experience inflows this week
According to Coinglass data, U.S. spot Bitcoin ETFs saw their fourth straight day of inflows on Thursday, totaling $84.80 million. Cumulatively, these inflows reached $861.50 million by Thursday this week, indicating rising investor confidence and potentially forecasting a short-term 5.5% increase in Bitcoin's price. Monitoring the net inflows of these ETFs is critical for grasping market dynamics and investor sentiment. As of Thursday, the collective Bitcoin reserves held by these 11 U.S. spot Bitcoin ETFs stood at $52.22 billion.
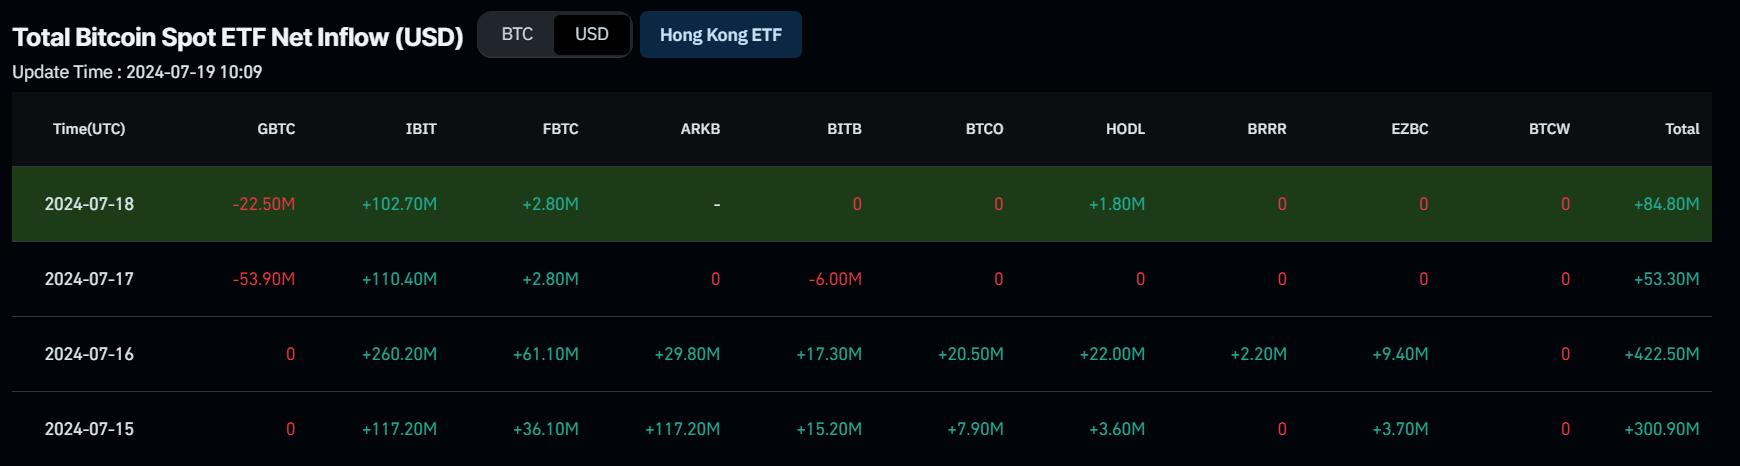
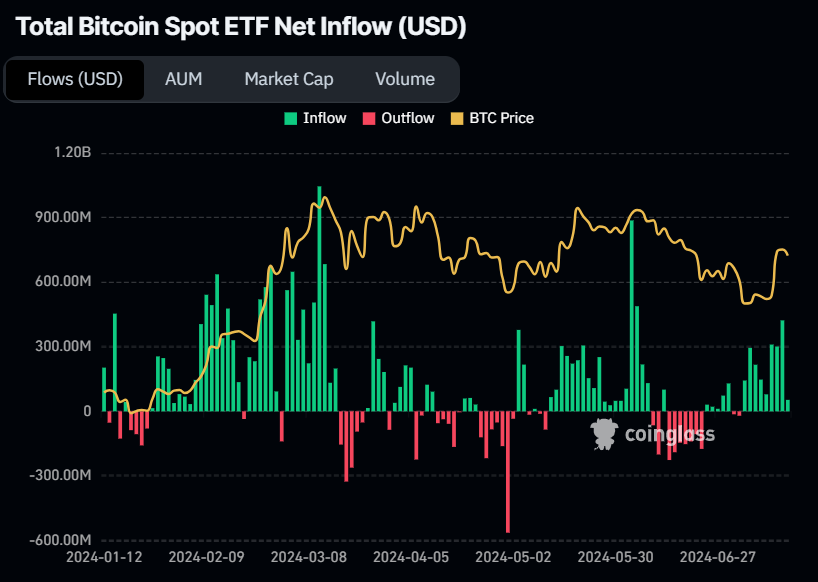
Total Bitcoin Spot ETF Net Inflow (USD) chart
Bitcoin on-chain data analysis looks promising
According to Santiment's Bitcoin Funding Rate and Positive Sentiment data, despite a mid-sized bounce in the crypto market this week, positive sentiment towards Bitcoin has sharply declined. Concurrently, many traders on platforms like Binance are initiating short positions, anticipating a further decline in BTC. These factors collectively heighten the potential for increased volatility in the cryptocurrency market.
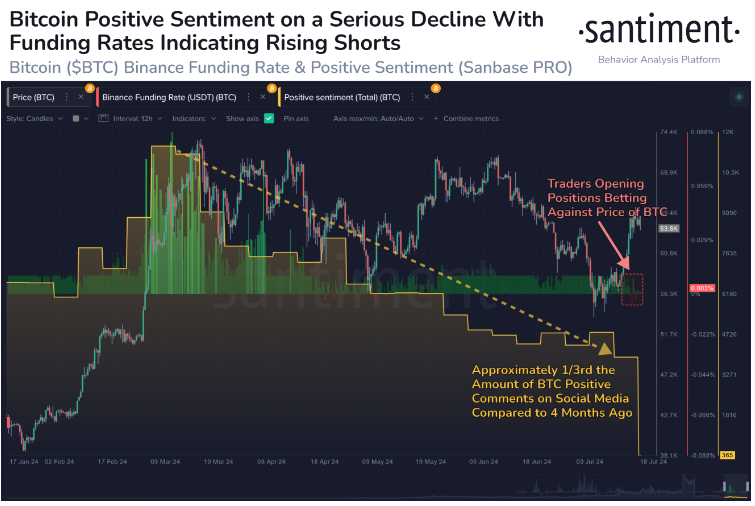
Bitcoin Funding Rate and Positive Sentiment Chart
The CryptoQuant Network Value to Transactions (NVT) Ratio provides crucial insights into market trends. It generates short—or long-term signals by comparing short-term and long-term NVT trends.
An NVT value above 2.2 suggests potential overbuying, indicative of a market top, while a value below -1.6 suggests overselling, signaling a potential market bottom.
Currently, the NVT value below -1.8 indicates local bottoms. If the 111-day moving average (DMA) holds above $65,000, there could be potential upward movement in the near term. These metrics suggest the market is oversold and may be poised for a recovery phase.
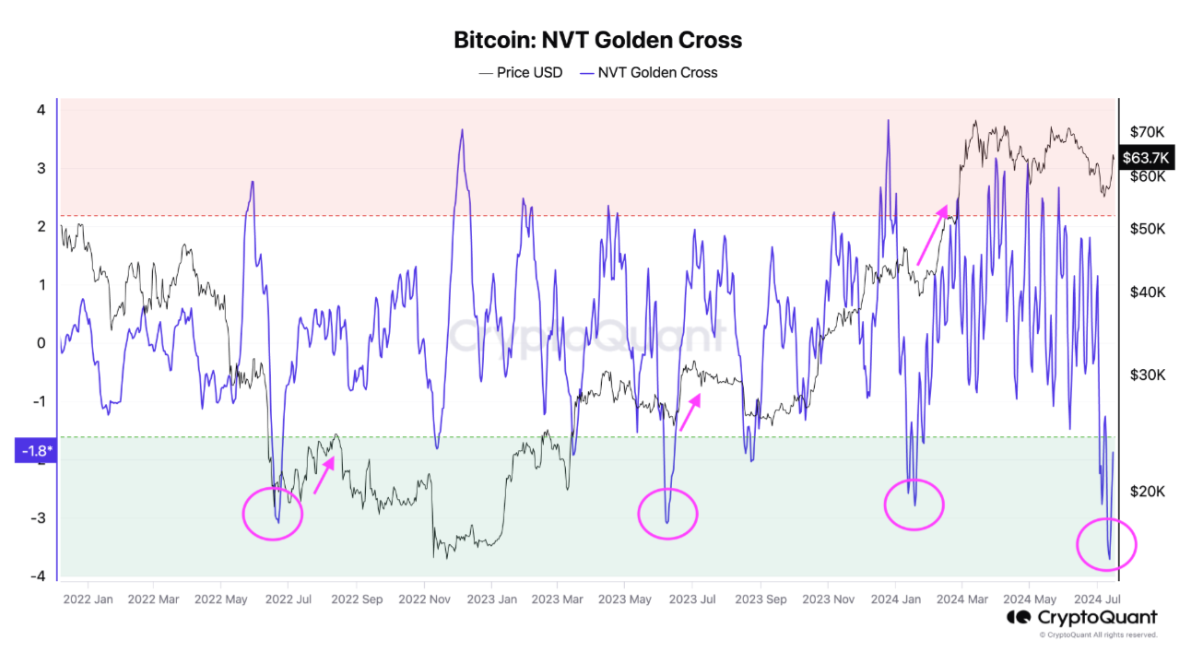
Bitcoin NVT Golden Cross chart
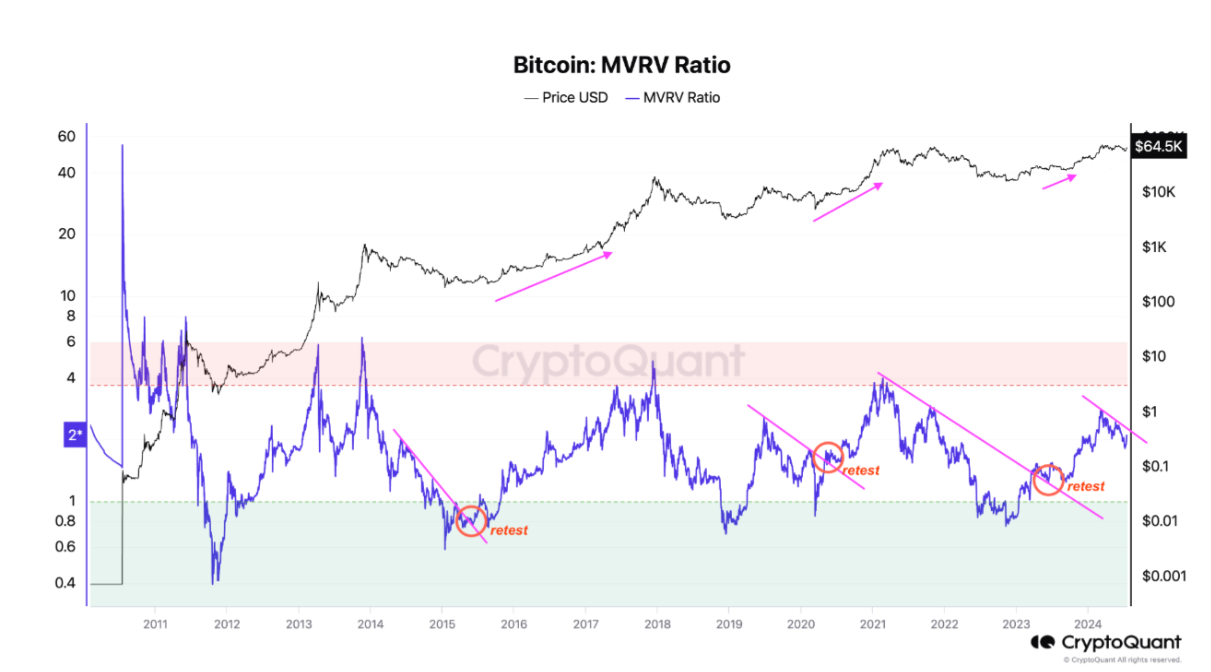
Additionally, monitoring the Market Value to Realized Value (MVRV) ratio is a valuable tool for investors, offering insights into whether current market conditions align with historical currency trends. A high MVRV ratio of 3.7 indicates historical peaks, while a ratio of 1 or below suggests lows.
Currently hovering around 2.1, the MVRV ratio attempts to break a downtrend. This could pave the way for significant price increases following a retest, akin to patterns observed in previous market cycles.
Bitcoin MVRV Ratio
Bitcoin price poised for pullback after retesting daily resistance at $65,000
Bitcoin price faced resistance near the daily level of $64,913 on Tuesday, leading to a 2% decline over the next two days. As of Friday, it is trading slightly higher by 0.23% at $64,166.
This level aligns closely with the 61.8% Fibonacci retracement level at $64,921, derived from the swing high of $71,997 on June 7 to the swing low of $53,475 on July 5, establishing a critical zone of resistance to monitor closely.
Sideline buyers seeking opportunities can consider positions between the $59,200 and $57,800 levels, where the previously broken trendline resistance now serves as support.
If BTC bounces off the $59,200 level, it could rise 9% to restest its daily resistance at $64,913.
On the daily chart, the Relative Strength Index (RSI) and the Awesome Oscillator (A.O.) reinforce the noted rebound, with both indicators positioned above their neutral thresholds of 50 and zero, respectively. This robust momentum signals a strong bullish sentiment in the market.
Furthermore, surpassing the $64,913 level could allow an additional 3.5% rise to retest its next weekly resistance at $67,209.
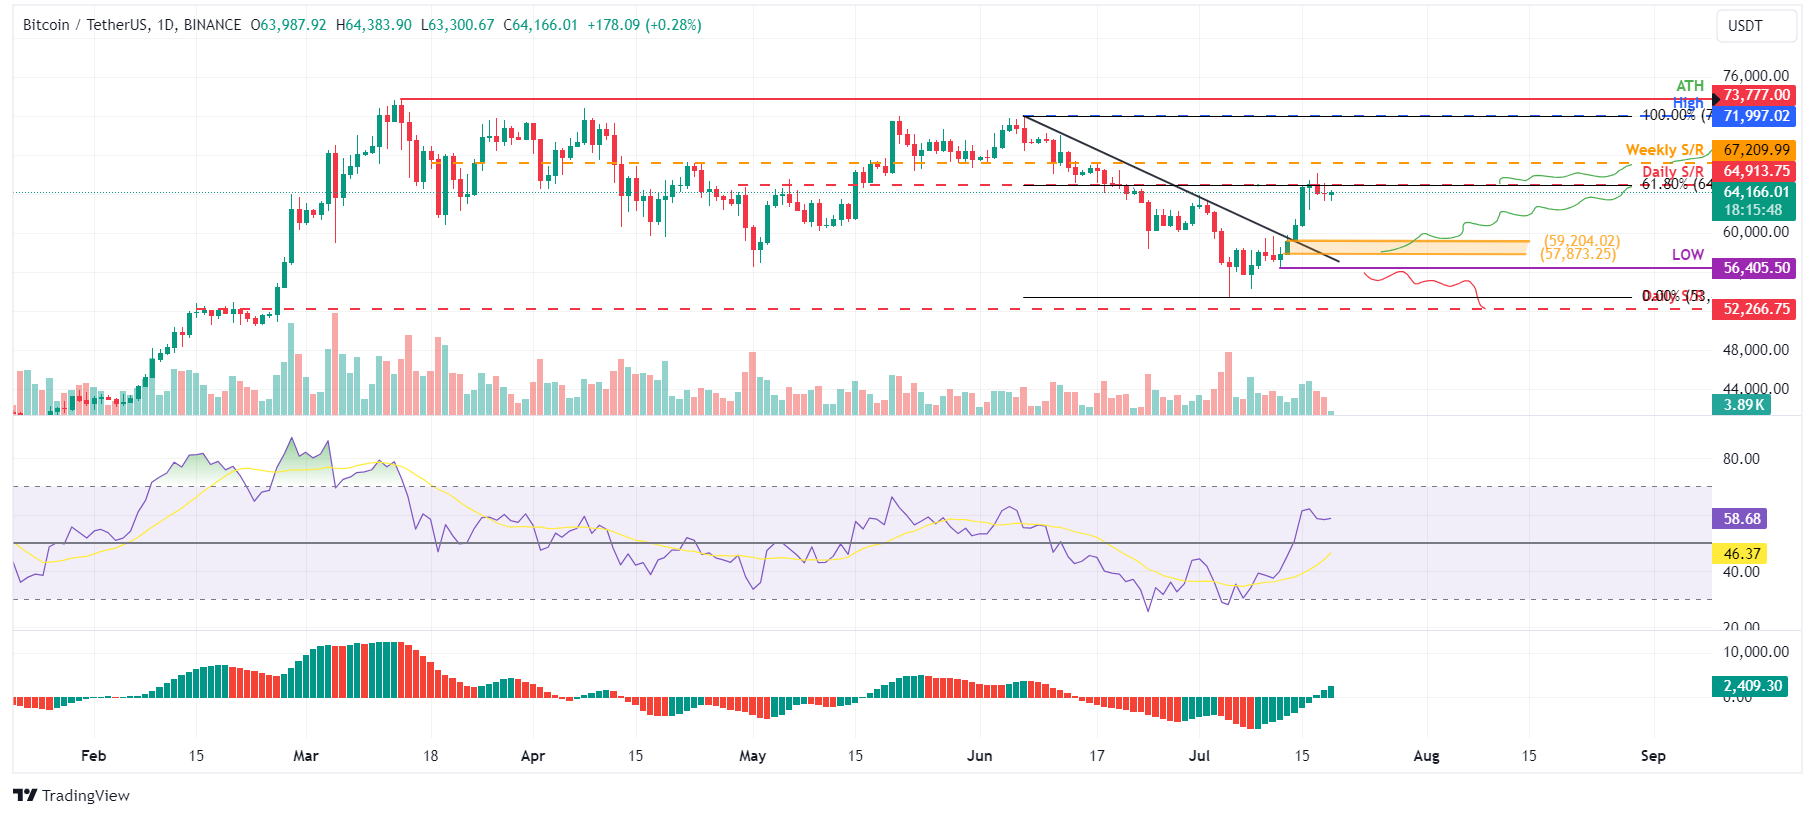
BTC/USDT daily chart
However, a close below $56,405 for BTC, accompanied by a formation of a lower low on the daily timeframe, could indicate sustained bearish sentiment. Such a scenario might precipitate a 7.5% decline in Bitcoin's price, potentially leading to a retest of its daily support level at $52,266.
Author

Manish Chhetri
FXStreet
Manish Chhetri is a crypto specialist with over four years of experience in the cryptocurrency industry.


