• THETA has hit a new all-time high at $0.76 and continues trading in price discovery mode.
  • A short-term correction seems to be on the menu for the digital asset according to several indicators.

THETA has been trading inside a robust uptrend for the past four months and hit a new all-time high at $0.76 on September 28. Its market capitalization has grown from $46 million on March 16, to a current high of $640 million.

Bears looking for a correction after a strong sell signal was presented

Just over the past five days, THETA is up by more than 36%. Many investors are wondering when the next correction period will start. According to several metrics, it seems to be nearby.

THETA/USD 12-hour chart

theta price

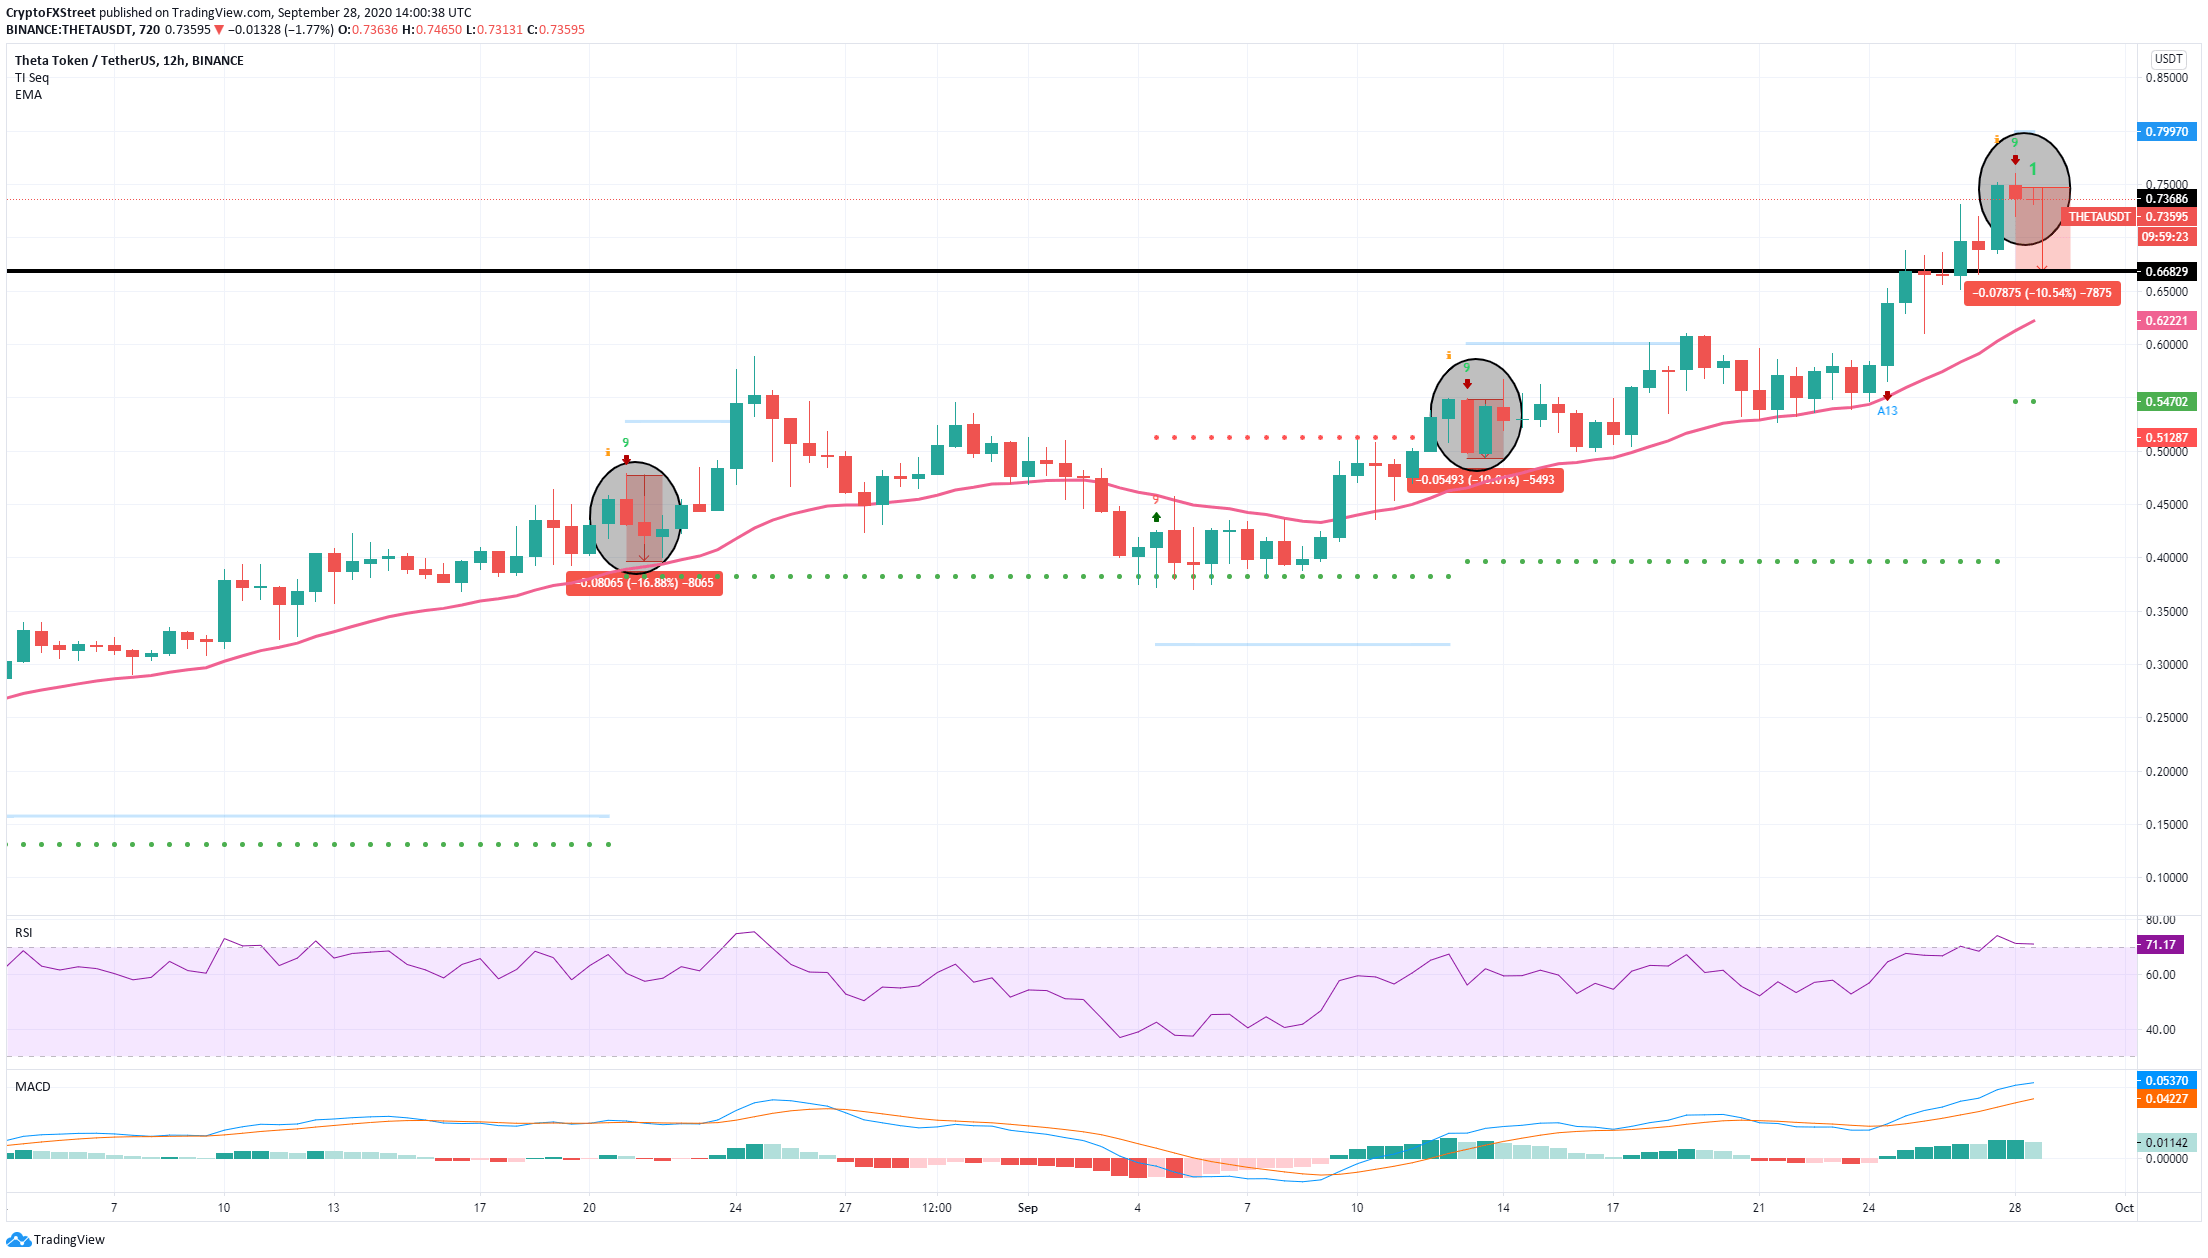
On the 12-hour chart, the TD sequential indicator has just presented a sell signal at around $0.75. If we look at the past two signals, they were both validated and followed by a 17% correction and 10% after the last one. The RSI has been overextended since September 27. Historically, this indicator has also been entirely accurate in showing upcoming correction periods for THETA. 

THETA IOMAP Chart

theta price

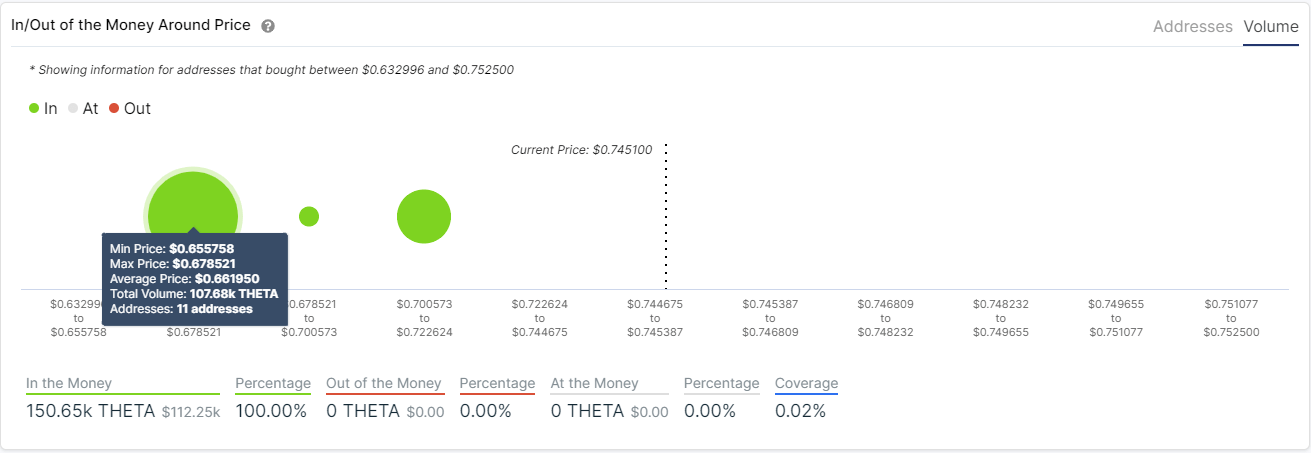
Another 10% pullback would take THETA down to $0.66. The In/Out of the Money Around Price chart by IntoTheBlock indicates that $0.66 is indeed a vital support area. We can see that between $0.65 and $0.67, around 107,000 THETA was bought, which is notable considering the digital asset is trading at all-time highs. Lower than this support level, bulls could find a good support point at $0.62 in the form of the 26-EMA on the 12-hour chart.

THETA is in price discovery mode

Nonetheless, the digital asset just hit a new all-time high, meaning that investors are still trying to figure out THETA's correct price. It's not easy to find the next resistance level or target price when an asset is trading at all-time highs.

THETA New Addresses Chart

theta price

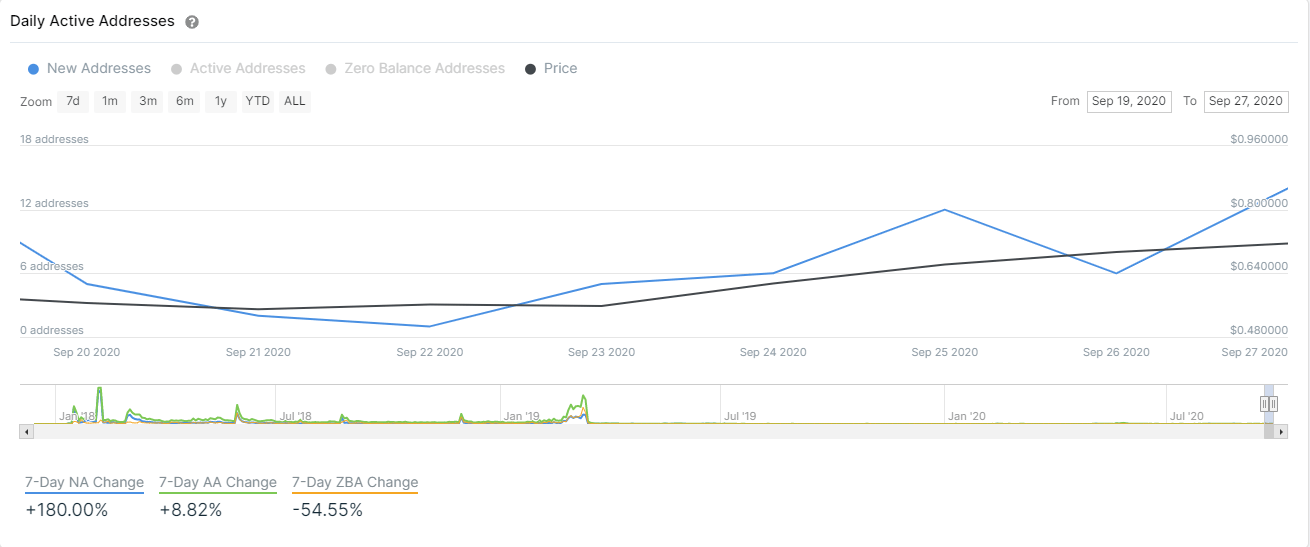
The number of new addresses seems to be going up after a low on September 1. This recent uptrend shows an increase in interest for THETA even though it is hitting all-time highs. 

THETA 4-hour chart

theta price

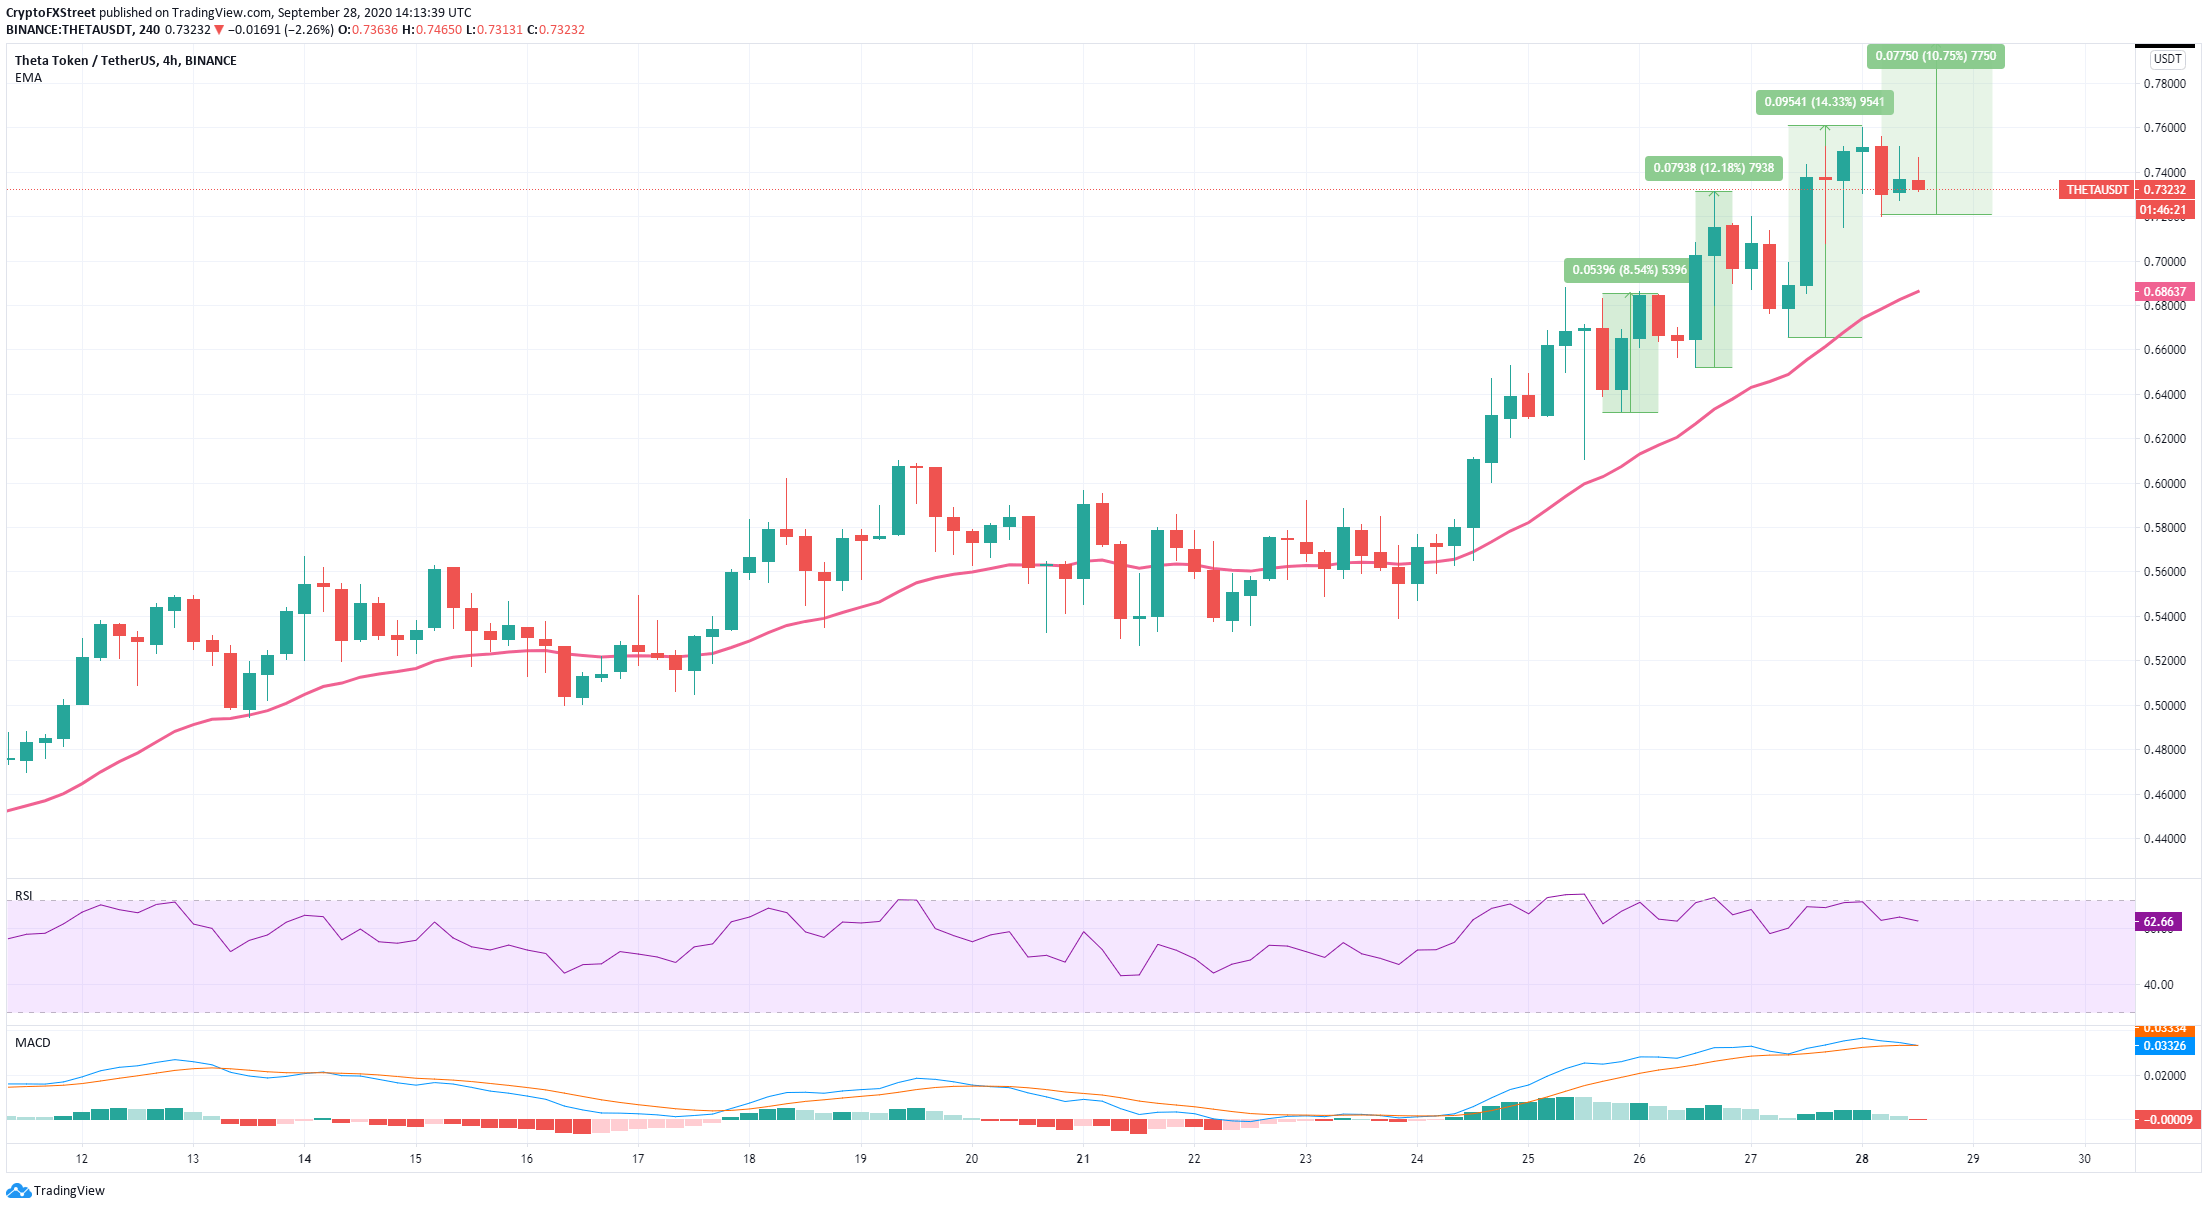
In the past three days, each pullback was followed by a new leg up with an average 11% price increase. If this trend continues, another 11% surge will take THETA up to $0.80, a psychological resistance level. 

Bullish investors need to keep an eye on the last high at $0.76 as it is the closest resistance level. On the other hand, if the sell signal on the 12-hour chart is validated, we could see THETA trade down to $0.66. 


Note: All information on this page is subject to change. The use of this website constitutes acceptance of our user agreement. Please read our privacy policy and legal disclaimer. Opinions expressed at FXstreet.com are those of the individual authors and do not necessarily represent the opinion of FXstreet.com or its management. Risk Disclosure: Trading foreign exchange on margin carries a high level of risk, and may not be suitable for all investors. The high degree of leverage can work against you as well as for you. Before deciding to invest in foreign exchange you should carefully consider your investment objectives, level of experience, and risk appetite. The possibility exists that you could sustain a loss of some or all of your initial investment and therefore you should not invest money that you cannot afford to lose. You should be aware of all the risks associated with foreign exchange trading, and seek advice from an independent financial advisor if you have any doubts.

Join Telegram

Recommended content


Recommended Content

Editors’ Picks

Dogwifhat price pumps 5% ahead of possible Coinbase effect

Dogwifhat price pumps 5% ahead of possible Coinbase effect

Dogwifhat (WIF) price recorded an uptick on Thursday, going as far as to outperform its peers in the meme coins space. Second only to Bonk Inu (BONK), WIF token’s show of strength was not just influenced by Bitcoin (BTC) price reclaiming above $63,000.

More Dogwifhat News

Runes likely to have massive support after BRC-20 and Ordinals frenzy

Runes likely to have massive support after BRC-20 and Ordinals frenzy

PUPS, WZRD, and PEPE are gaining liquidity through Bitcoin Ordinals. Creator of Bitcoin’s Ordinals protocol is debuting a new fungible token standard to rival BRC-20, Runes.

More Cryptocurrencies News

Ethereum shows firm support at key level as its correlation with US indices increase

Ethereum shows firm support at key level as its correlation with US indices increase

Ethereum's price continued a sideways movement on Thursday as the market still awaits a trigger. Ethereum isn't alone in this horizontal trend; several major index funds have also traded sideways.

More Ethereum News

Mango Market attacker convicted of fraud and market manipulation

Mango Market attacker convicted of fraud and market manipulation

Mango Market attacker Avi Eisenberg was convicted by a federal jury on Thursday for "fraudulently obtaining" funds from the Solana-based decentralized exchange (DEX). He could face up to 20 years in prison for his role in the $110 million attack.

More Cryptocurrencies News

Bitcoin: BTC’s rangebound movement leaves traders confused

Bitcoin: BTC’s rangebound movement leaves traders confused

Bitcoin (BTC) price has been hovering around the $70,000 psychological level for a few weeks, resulting in a rangebound movement. This development could lead to a massive liquidation on either side before a directional move is established. 

Read full analysis

BTC

ETH

XRP