Top 3 Price Prediction Bitcoin, Ether, Ripple: Bulls and bears face-to-face on the crypto board
- The XRP/USD pair is on the verge of a confrontation between the two sides of the market.
- Bitcoin remains weak against Altcoin despite yesterday's rise.
- Negative market sentiment shapes a technical floor and could trigger an opposite sentiment signal.

The crypto market is quiet after the significant recovery of the BTC/USD pair from the day's lows of 9.5%. ETH/USD recovery was just over 6%, while XRP/USD was under 5.5%.
After these moves, the Bitcoin temporarily regained 3% market share, although as we can see from the chart, it was a move without technical consequences. The dominance level continues below the favourable scenario for the Bitcoin, and the MACD indicator remains crossed downwards but at a robust bullish level.
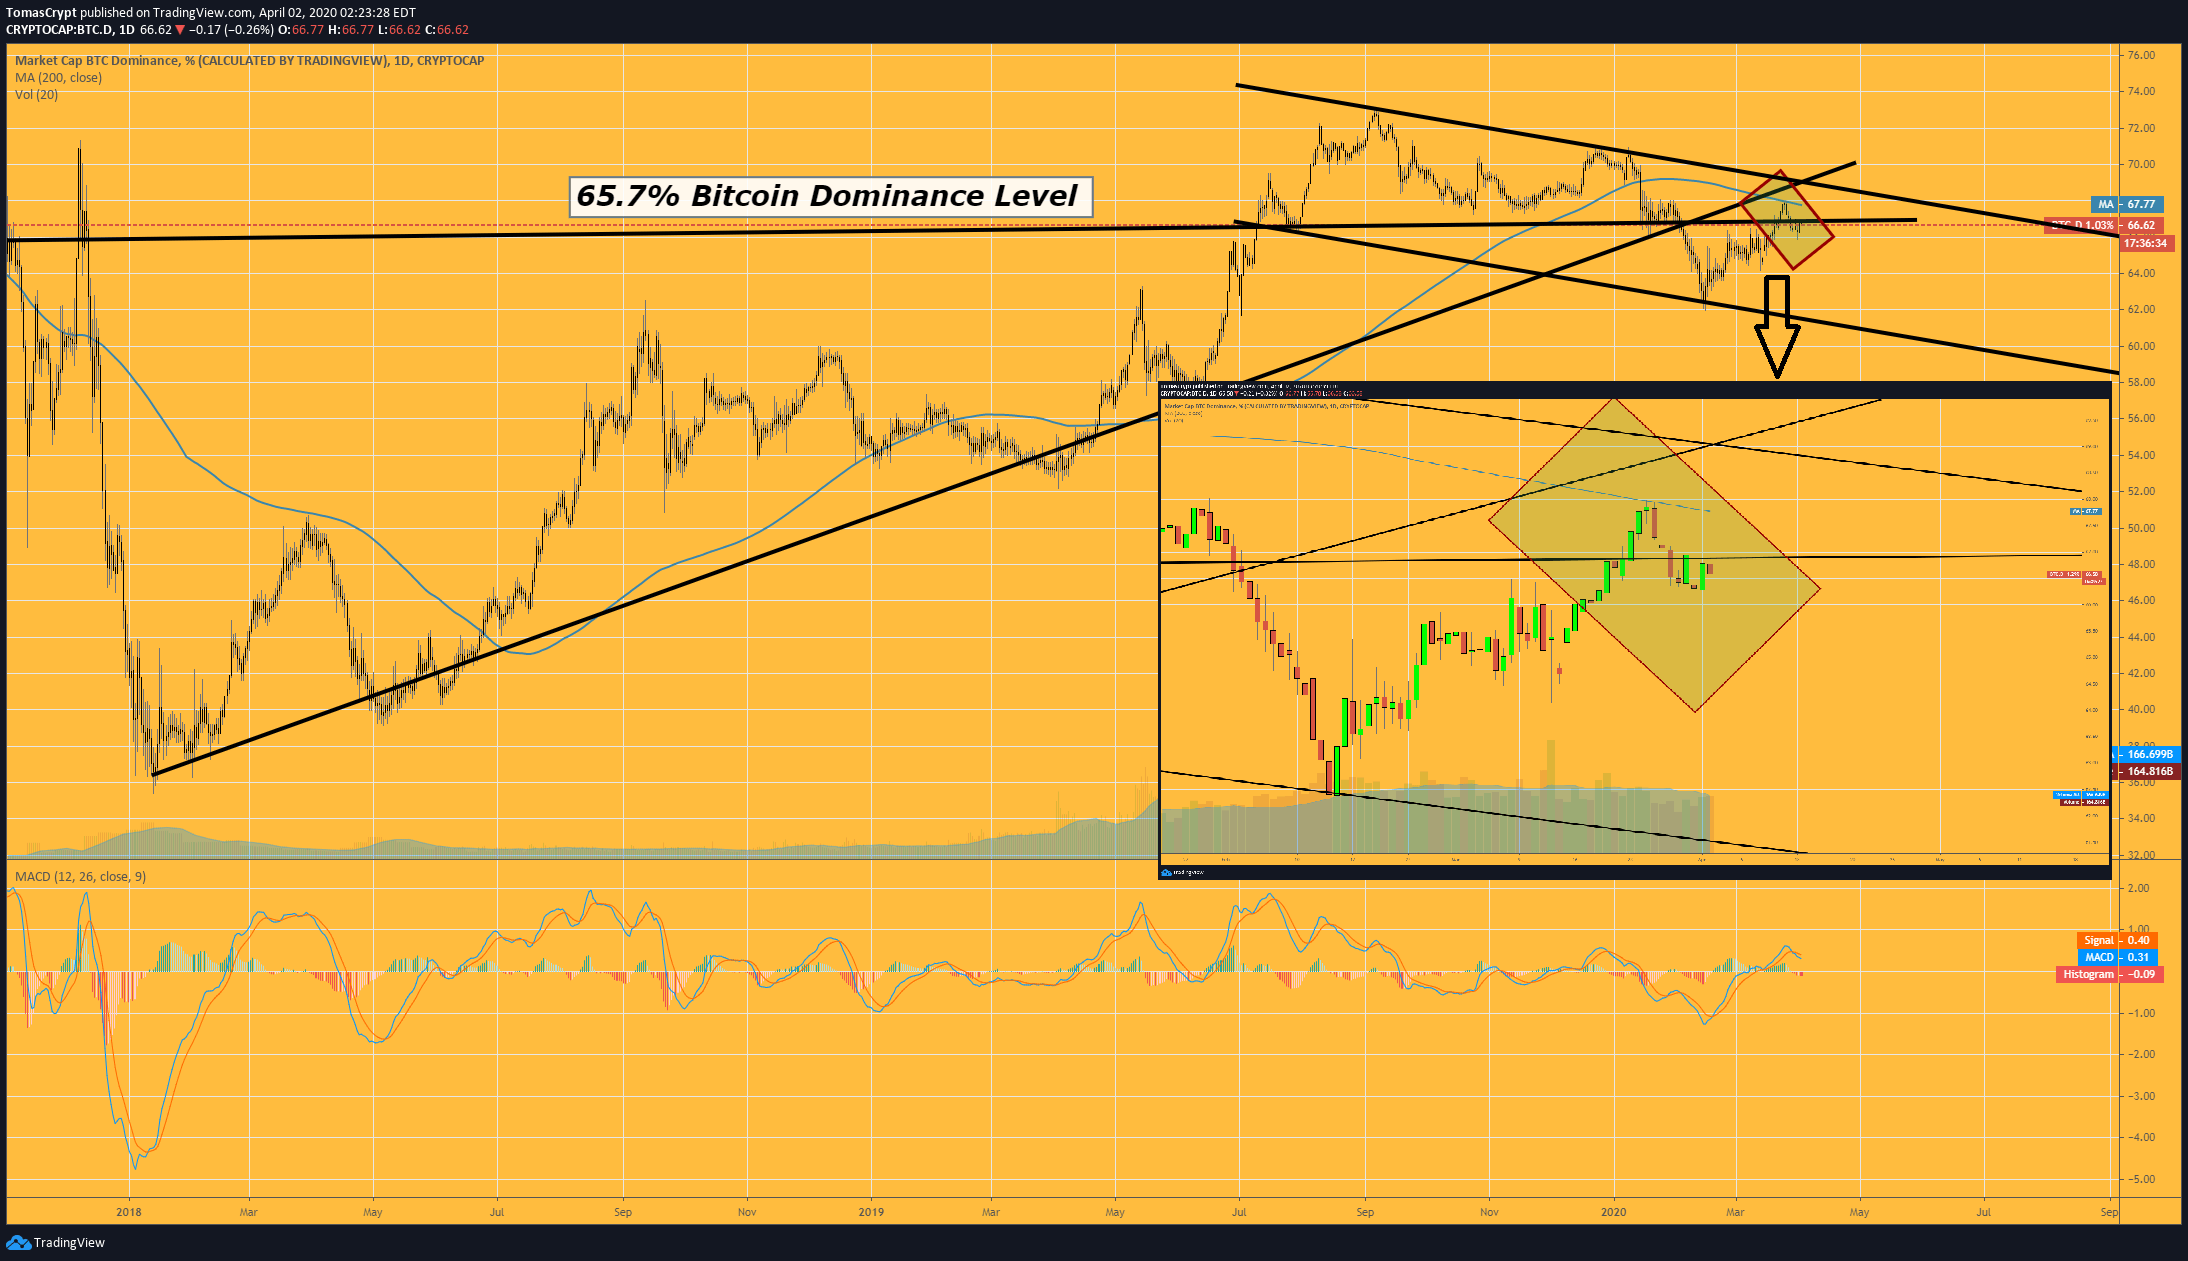
The technical structures announce that soon the bulls will try to take control of the market from the bears. These scenarios are very evident in the case of XRP and perhaps somewhat later in Bitcoin and Ether.
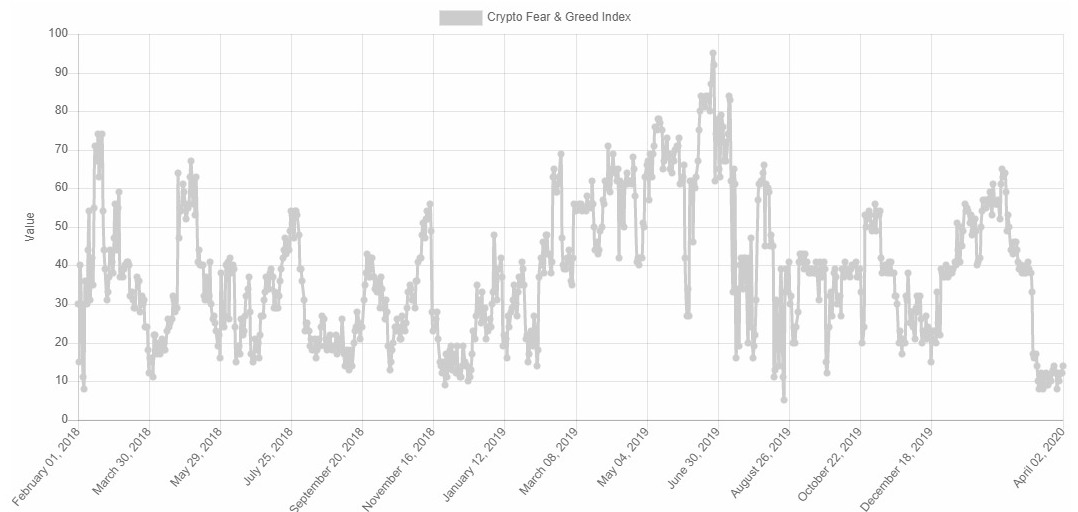
The market sentiment provided by the site alternative.me has improved by two points since yesterday and is at level 14, still in the "Extreme Fear" zone.
ETH/BTC Daily Chart
The ETH/BTC pair is currently trading at 0.0206, after yesterday's failed attempt to break the SMA200. The main average rejects the bullish attack violently, although the chances of a repeat attempt are very high.
Above the current price, the first resistance level is at 0.0211, then the second at 0.0217 and the third one at 0.022.
Below the current price, the first support level is at 0.0198, then the second at 0.0186 and the third one at 0.018.
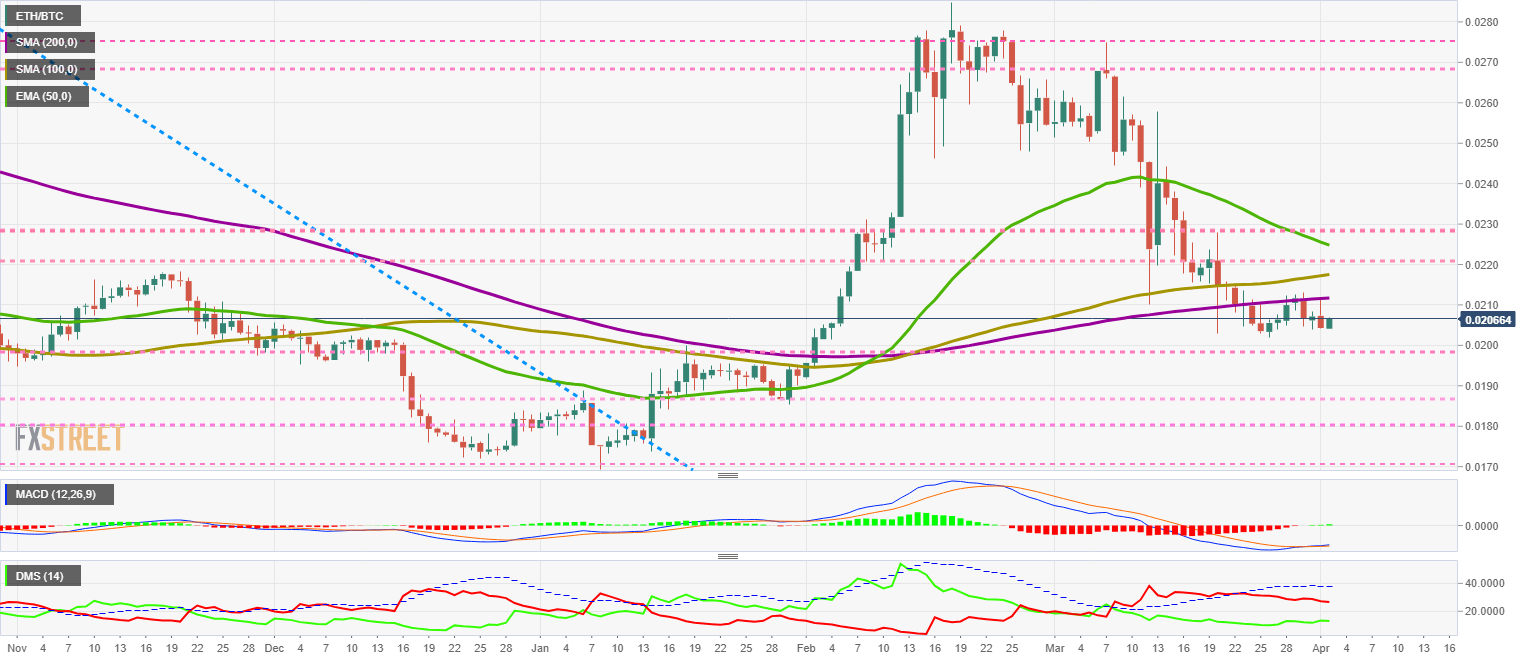
The MACD on the daily chart confirms the bullish cross, although the slope and line spacing are minimal. We cannot rule out a failure that undoes the bullish momentum.
The DMI on the daily chart confirms the current lack of bullish momentum. Fortunately for the bulls, the bears are not feeling strong either and both sides of the market are maintaining the previous "status quo".
BTC/USD Daily Chart
The BTC/USD pair is currently trading at the price level of $6636 after failing to break through the price congestion resistance at $6765, a level that is beginning to be relevant because of the number of times it has stopped the BTC/USD from rising.
Above the current price, the first resistance level is at $6765, then the second at $6865 and the third one at $7135. This last resistance level coincides with the long term downward channel ceiling.
Below the current price, the first support level is at $6500, then the second at $6400, and the third one at $6300.
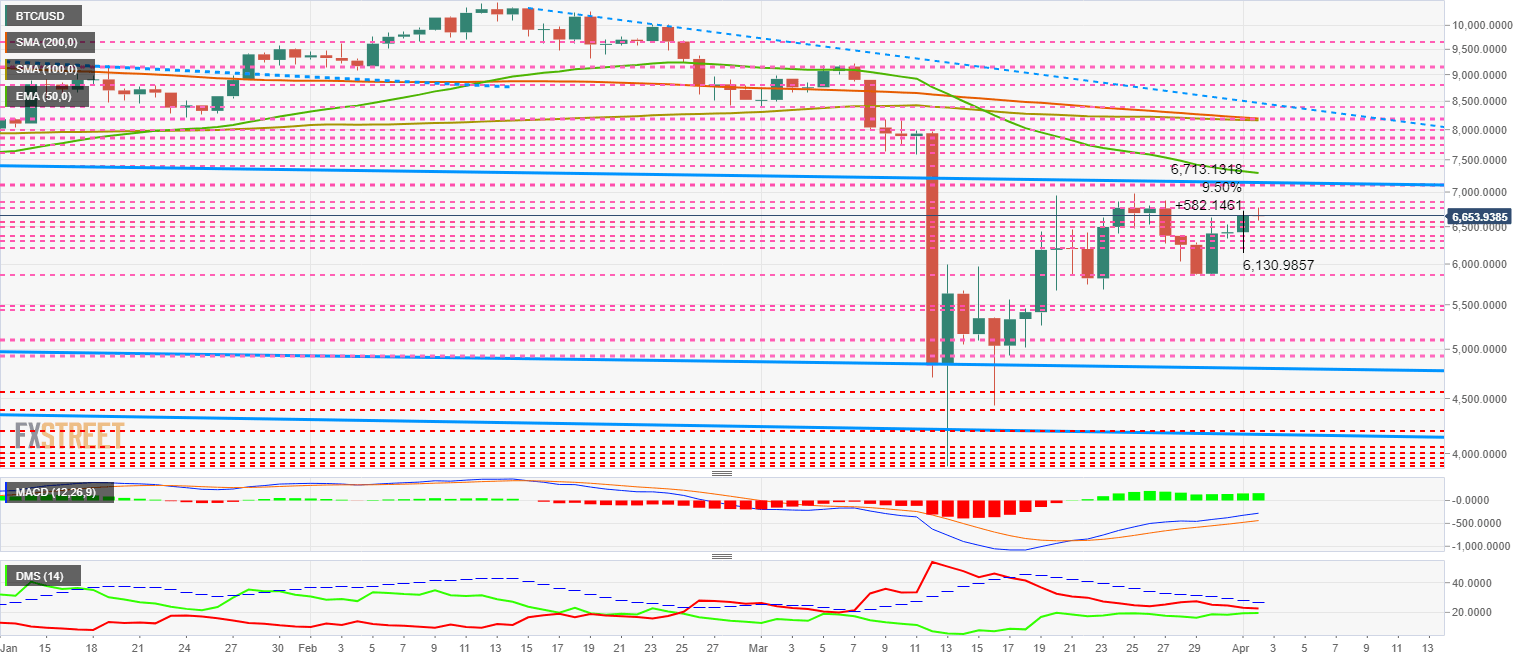
The MACD on the daily chart shows that the upward slope is improving slightly, while the opening between the lines remains. The zero level of the indicator, which separates the upside from the downside, is close and could be an obstacle to upward movement.
The DMI on the daily chart shows that a collision between the two sides of the market is imminent, which could lead to increased volatility.
ETH/USD Daily Chart
The ETH/USD pair is currently trading at $137.44 and is looking to reach the milestone of a four-day upward movement, which has not happened since mid-February.
The main moving averages are around $175 and form a massive attractive area for the spot price.
Above the current price, the first resistance level is at $142.5, then the second at $151 and the third one at $154.
Below the current price, the first support level is at $161, then the second at $166 and the third one at $170.
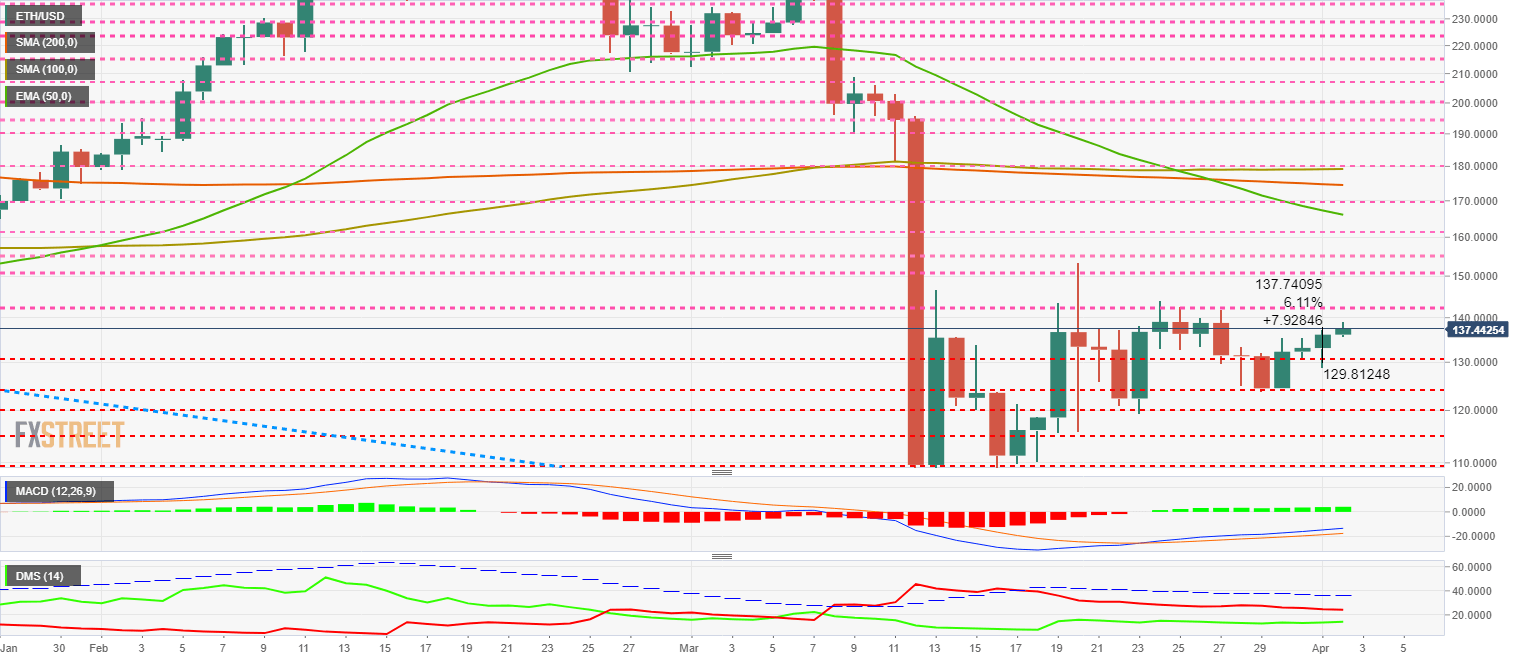
The DMI on the daily chart shows the bulls slowly approaching the bears, which also do their part to bring about the inevitable confrontation between the two forces governing the market.
XRP/USD Daily Chart
The XRP/USD pair is currently trading at the price level of $0.1770 and is approaching the long-term bearish channel ceiling at the price level of $0.1819.
Above the current price, the first resistance level is at $0.1819, then the second at $0.1913 and the third one at $0.20.
Below the current price, the first support level is at $0.1717, then the second at $0.1621 and the third one at $0.1505.
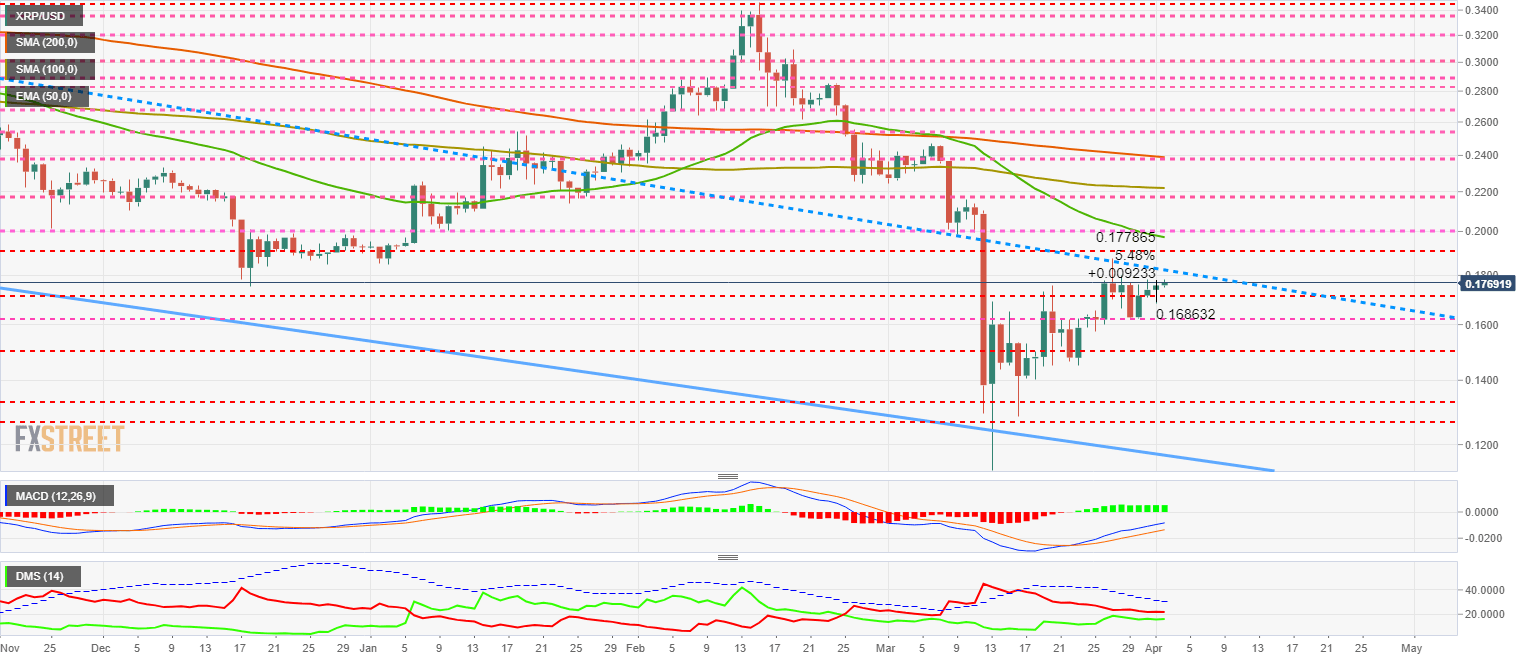
The DMI on the daily chart shows that the bulls are getting a little closer to the bears, announcing a showdown soon. This clash between the two sides of the market will coincide with the attempt to break out of the long-term bearish channel ceiling.
Get 24/7 Crypto updates in our social media channels: Give us a follow at @FXSCrypto and our FXStreet Crypto Trading Telegram channel
Author

Tomas Salles
FXStreet
Tomàs Sallés was born in Barcelona in 1972, he is a certified technical analyst after having completing specialized courses in Spain and Switzerland. He expanded his technical training following the guidance of great experts on the financial markets.


