Top 3 Gainers Of The Week NEM, Celsius, HedgeTrade: The altcoins outperforming Bitcoin
- Bitcoin won the battle, but NEM, Celsius and HedgeTrade won the war this week.
- NEM’s uptrend is in jeopardy after the TD Sequential Indicator presented a sell signal on the 4-hour chart.
- Celsius is on the verge of a massive correction after its uptrend hit a key ascending parallel channel barrier.
- HedgeTrade still has the muscle to jumpstart the bull run eying the critical hurdle at $1.2.

It has been an action-packed week for the cryptocurrency space and for the United States and the people eager to know the outcome of the 2020 presidential election. Bitcoin went ballistic, trading new yearly highs close to $16,000. The last time Bitcoin traded at this level was in late 2018. Other major cryptocurrencies rallied in tandem with BTC. For instance, Ethereum stepped above $440 while Litecoin spiked past $60.
Some selected altcoins appear to have outperformed the flagship cryptocurrency, posting more than 30% in gains. NEM (XEM) is up 32%, Celsius (CEL) up 35% and HedgeTrade up 38%. This article aims to shine the light on these three tokens to figure out what caused the tailwind, pushing them to higher levels.
NEM impressive breakout targets $0.16
XEM/USD broke out of a descending parallel channel. A move that perhaps contributed to the remarkable price action. Before the bullish reversal, the token was confined in the channel due to the rejection at $0.16. The pattern’s middle boundary played an instrumental role in jumpstarting the recovery. Besides, trading above the 50-day Simple Moving Average and 200-day SMA allowed the bulls to focus on higher levels.
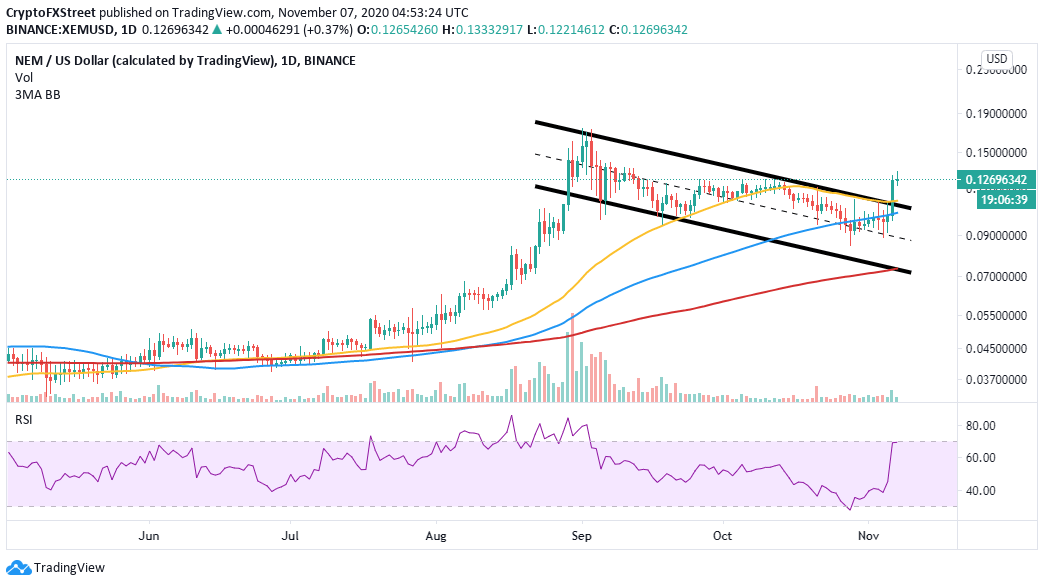
XEM/USD daily chart
Meanwhile, NEM is changing at $0.127 while the price is in the hands of the bulls. The Relative Strength Index is almost entering the overbought region, which implies further growth. Support is required above $0.12 to give the bulls ample time to plan the next attack angle for gains heading to $0.165.
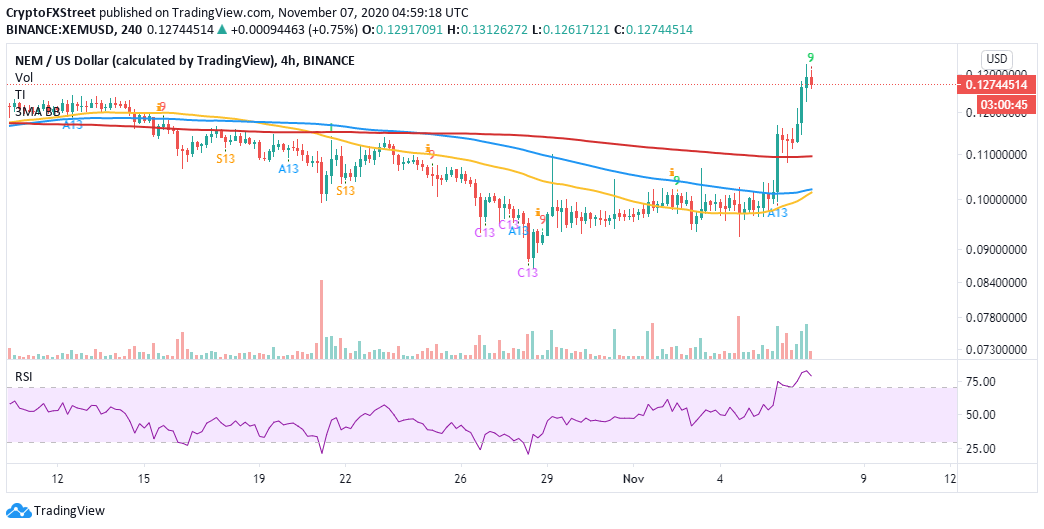
XEM/USD 4-hour chart
The TD Sequential indicator has discredited the bullish potential by presenting a sell signal on the 4-hour chart in the form of a green nine candlestick. If sell orders rise in the coming sessions, NEM might break down to test support at $0.11, highlighted by the 200 SMA. The RSI is also on a retreat motion from the overbought, suggesting that it is time for a reversal.
Celsius uptrend hits a key barrier
CEL has been on this upward roll since March. There have been instances of retreat, but generally, the trend maintained a bullish outlook within a parallel ascending channel. Currently, the cryptoasset is trading at $1.86 after encountering resistance at the channel’s upper boundary.
-637403268522770038.png)
CEL/USD daily chart
The RSI seems to have hit a wall and is likely to correct from the overbought region. On the downside, the first point of contact would be the channel’s middle boundary, which coincides with the 50-day SMA. If declines extend, Celsius will seek refuge at the 100-day SMA or the channel’s lower limit.
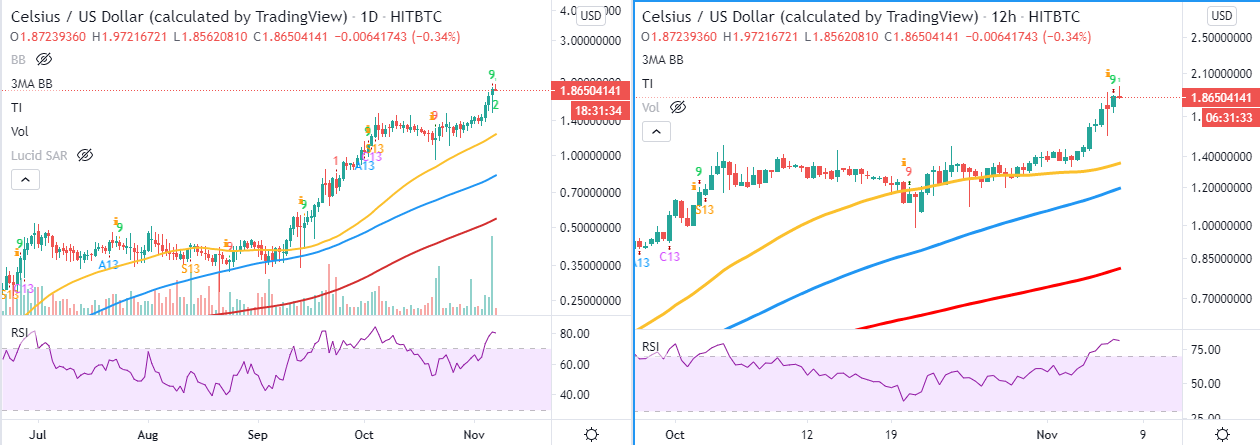
CEL/USD 12-hour and daily charts
The TD Sequential Indicator gave credence to the bearish outlook by presenting sell signals on the 12-hour and the daily charts. The sell signals are the green nine candlesticks and likely to encourage more sellers to join the market. On the 12-hour chart, the first point of contact would be the 50 SMA highlighted at $1.4, while on the daily chart, the price will encounter support at $1.2, as shown by the 50 SMA.
It is essential to note that the sell signals and the bearish narrative would be invalidated if Celsius closes the day above the channel’s upper boundary. An increase in buy orders at this level could pull CEL above $2 and catapult it towards $2.5.
HedgeTrade struggles to sustain the uptrend
HedgeTrade broke out of a descending parallel channel to start the massive price action encountered all week long. The upsurge hit highs above $1 and tested the resistance at $1.2. However, a correction ensued with the cryptoasset seeking support at the 200 SMA in the 4-hour range.
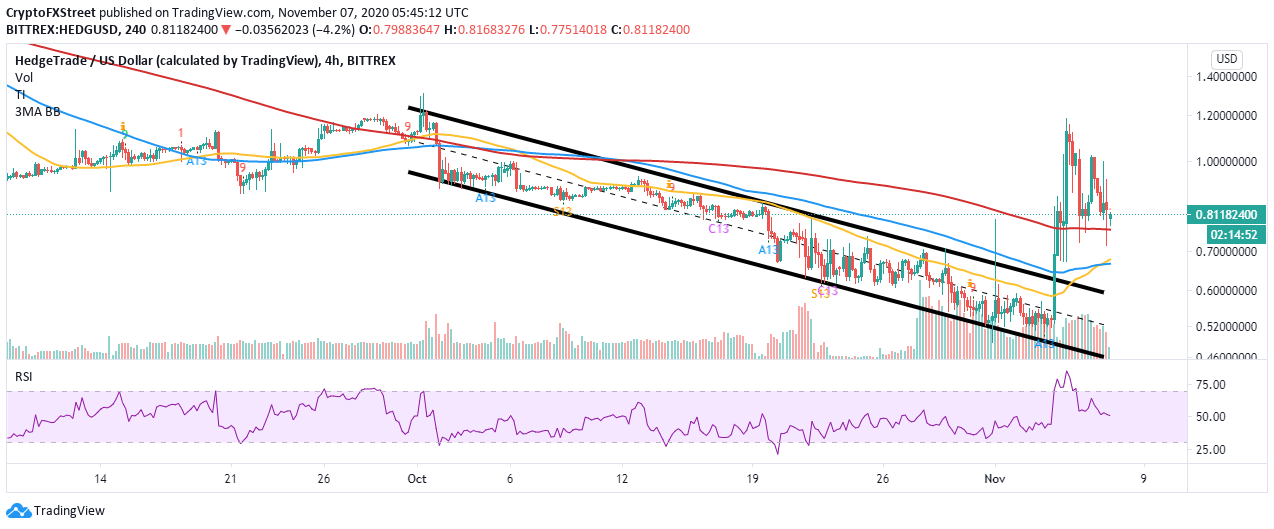
HEDG/USD 4-hour chart
At the time of writing, HEDG is changing at $0.81 amid the struggle to resume and sustain the uptrend. The RSI hints at a continued breakdown as it slides under the midline. Losses under the 200 SMA could extend to $0.7, an area marked by the 50 SMA and the 100 SMA.
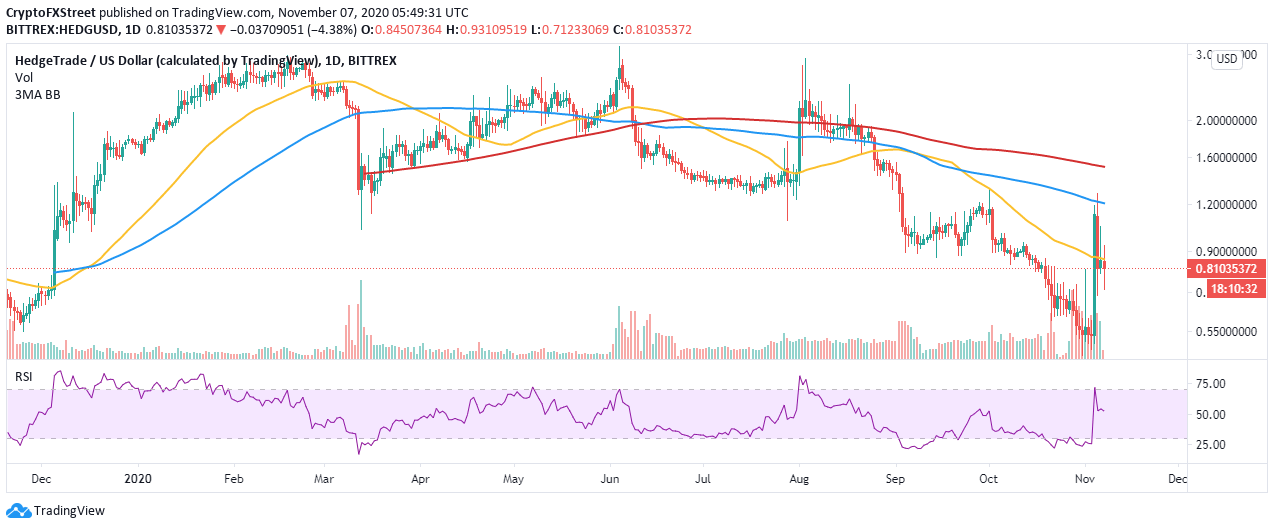
HEDG/USD daily chart
If HedgeTrade breaks past the 50-day SMA, buyers are likely to regain control over the price and pull beyond $1.2, a resistance marked by the 100-day SMA. Price action above this zone might not be massive because the 200-day hurdle could slow down the uptrend by absorbing some of the buying pressure.
Author

John Isige
FXStreet
John Isige is a seasoned cryptocurrency journalist and markets analyst committed to delivering high-quality, actionable insights tailored to traders, investors, and crypto enthusiasts. He enjoys deep dives into emerging Web3 tren


