Bitcoin Price Forecast: BTC overvalued, on the verge of correction
- The relative strength index (RSI) has been trending in the overvalued region since October 20.
- The 12-hour BTC chart is on the verge of flashing the sell signal with a green-nine candlestick.

Bitcoin has been flying high for a month, recapturing the imagination of the mainstream. Since October 7, the price has gone up from $10,600 to $15,665. However, it looks like the resulting FOMO has bloated the price to overvalued levels.
Bitcoin to face correction?
Following a heavily bullish Thursday, the price has started to move horizontally, as BTC reaches the cusp of the $16,000-zone. The relative strength index (RSI) has been trending in the overvalued region since October 20. This shows that the price is significantly overvalued and will face bearish correction soon.
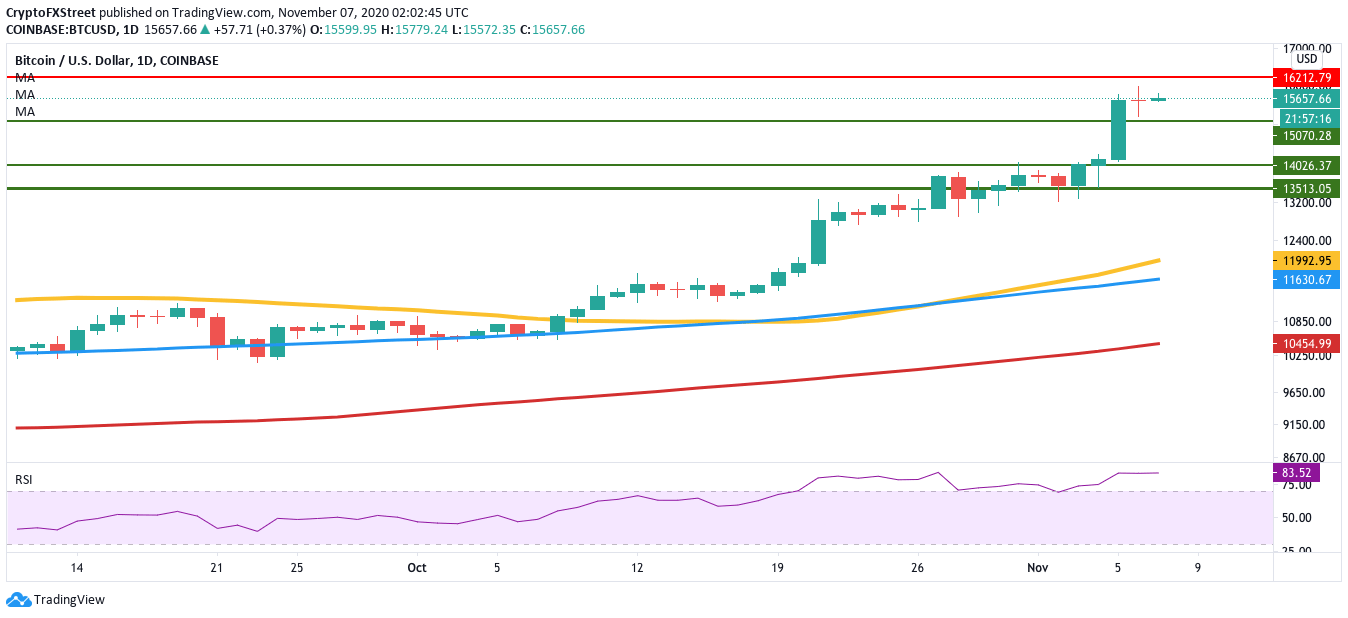
BTC/USD daily chart
The 12-hour chart further validates this bearish outlook. In this timeframe, the price is on the verge of flashing the sell signal via green-nine candlestick in the TD sequential indicator. It looks like the price is facing immense selling pressure as the premier cryptocurrency nears $16,000.
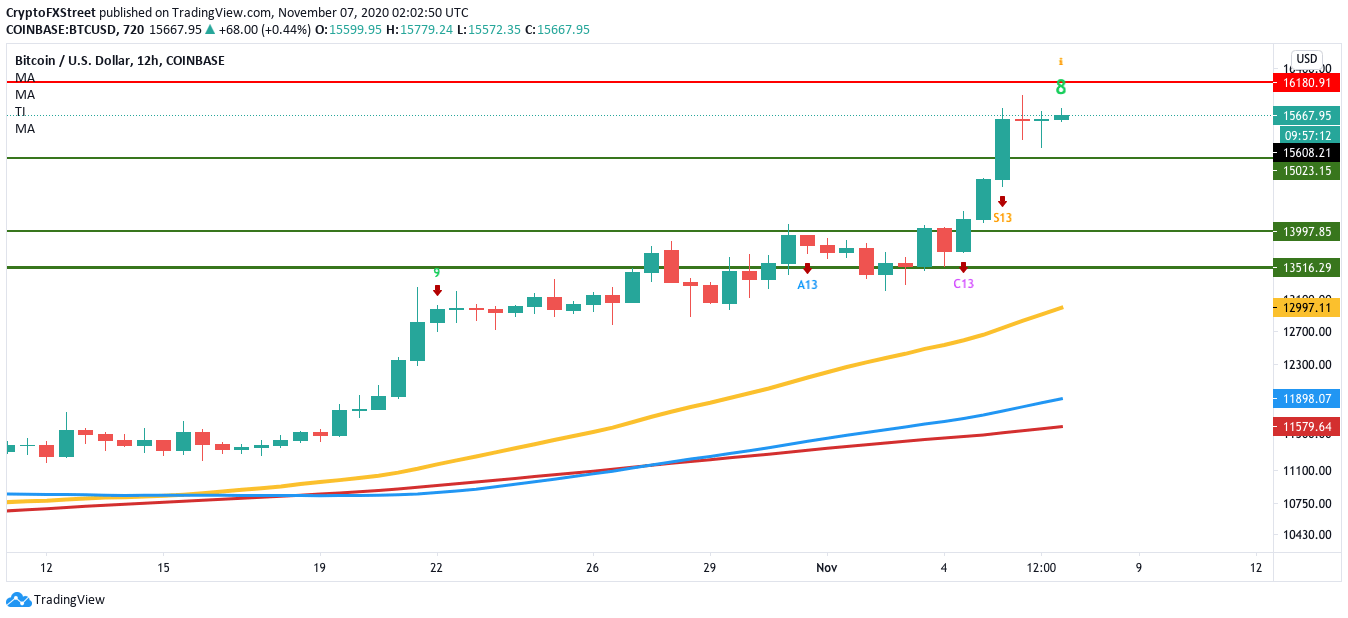
BTC/USD 12-hour chart
IntoTheBlock’s In/Out of the Money Around Price (IOMAP) shows strong support and resistance zones. It’s a helpful metric that shows us how far the price may fall. So, there appears to be a strong support wall at $15,000, which should absorb a lot of selling pressure.
If the bears manage to break below this wall, they will face two more support walls at $14,000 and $13,500. These two levels should be strong enough to absorb any residual selling pressure. This effectively caps off BTC’s downside at $13,500.
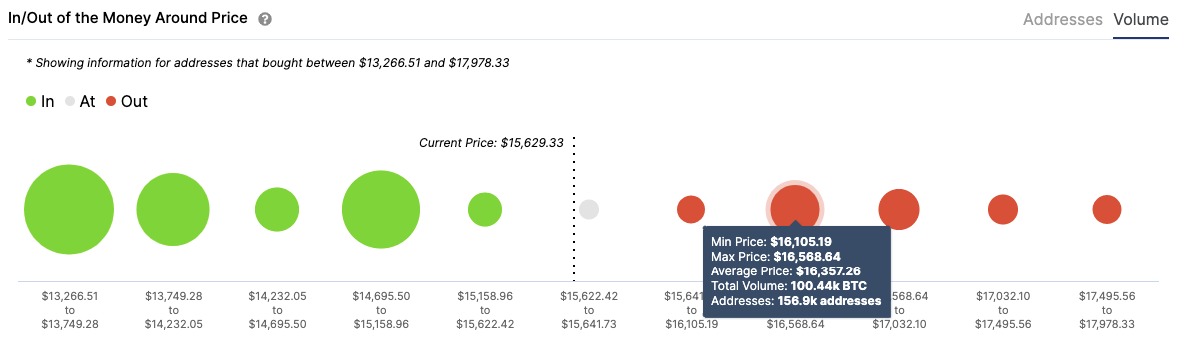
BTC IOMAP
On the flipside, it looks like this upcoming bearish correction has not affected the whales whatsoever, as they keep on accumulating. As per Santiment’s holders distribution chart, the number of addresses holding 10,000-100,000 tokens went up from 104 to 109 since October 21. This is a very positive sign for the network.
 [06.48.07, 07 Nov, 2020]-637403127339207744.png)
Bitcoin holders distribution
To sum up, BTC is on the verge of a price correction. However, strong support walls will cap off the downside at $13,500. Meanwhile, the bulls are strengthening their positions despite this upcoming correction.
Author

Rajarshi Mitra
Independent Analyst
Rajarshi entered the blockchain space in 2016. He is a blockchain researcher who has worked for Blockgeeks and has done research work for several ICOs. He gets regularly invited to give talks on the blockchain technology and cryptocurrencies.


