This subtle sign suggests that Tezos (XTZ) price will rally 20% in the coming days
- Tezos price prints a subtle bullish divergence on the daily time frame.
- The volume profile indicator is still relatively less than the volume that produced the summertime rally.
- Invalidation of the bullish thesis is a breach below $1.437.

Texos price shows possibility of a bullish retaliation targeting the September high at $1.75.
Tezos price shows posirtive signals
Tezos price could make a run for new highs in the coming days. A subtle bullish divergence has been established on the Relative Strength Index as the bears have printed a large engulfing candle. The divergence occurs above supportive buyer’s territory which confounds the idea that a smart money bear trap could be on the table.
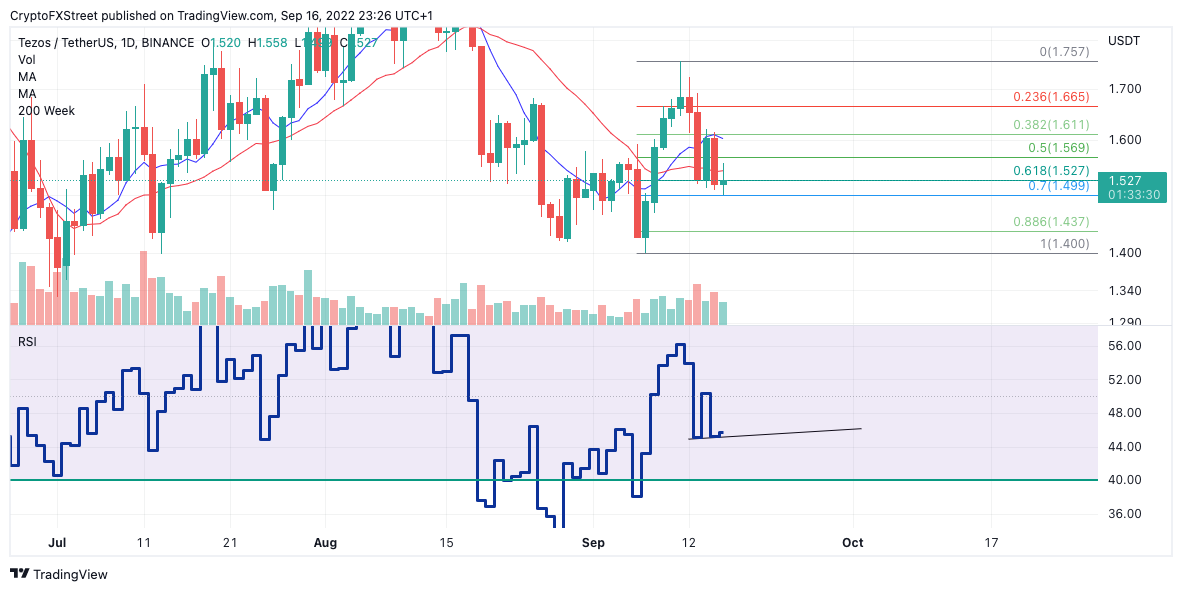
Tezos price currently auctions at $1.52 as the bulls are attempting to reconquer the 21-day simple moving average (SMA). The Volume Profile Indicator confounds the idea that an uptrend move is still possible as the bearish volume which induced the current sell-off is still relatively less than the volume established during the summertime rally. Additionally the current price is just below the 61.8% FIbonacci level based on the previous swing low and swing high in September.
XTZ USDT
When combining these factors, the traders who have their stop losses placed above the $1.75 could witness a challenge. Invalidation of the bullish thesis is a closing candle below the .886 Fibonacci level currently positioned at $1.437
In the following video, our analysts deep dive into the price action of Cardano, analyzing key levels of interest in the market. -FXStreet Team
Author

Tony M.
FXStreet Contributor
Tony Montpeirous began investing in cryptocurrencies in 2017. His trading style incorporates Elliot Wave, Auction Market Theory, Fibonacci and price action as the cornerstone of his technical analysis.


