Tezos' XTZ price bottomed last time this happened, is history set to repeat?
- Tezos price shows low volume during the steep declining rally and a bullish presence during the current consolidation.
- XTZ price has retested a historical trendline while dually revisiting an RSI low that prompted a previous market bottom.
- Invalidation of the bullish outlook is a closing candle below the ascending trendline currently positioned at $1.18 on the 2-day chart.

Tezos price shows reasonable countertrend evidence. A breach of the June 30 swing highs could trigger a 40% rally.
Tezos price says prepare for a bounce
Tezos price has seen an 83% decline since the all-time highs at $9.14 back in October 2021. The bearish strength is prevalent within the technicals, as the bulls have been unable to retrace at least 50% of each subsequent decline.
Tezos XTZ price currently trades at $1.51. A break above the June 30 swing high at $1.68 could trigger a 40% rally into the $2.30 price zone. On the contrary, if the bulls cannot rally soon, the fourth retest of a historical trendline will inevitably occur near the $1.20 price zone.
Tezos price confounds the idea of a short-term bounce on the Volume Profile Indicator. The bears are sparsely scattered around the 2021 decline from $5.89. There seems to be a subtle uptick in transactions after Tezos recently reacquainted with the historical ascending trendline at $1.19. The trendline dates back to October 2020 when the Tezos price showed congestion near all-time lows at $0.75.
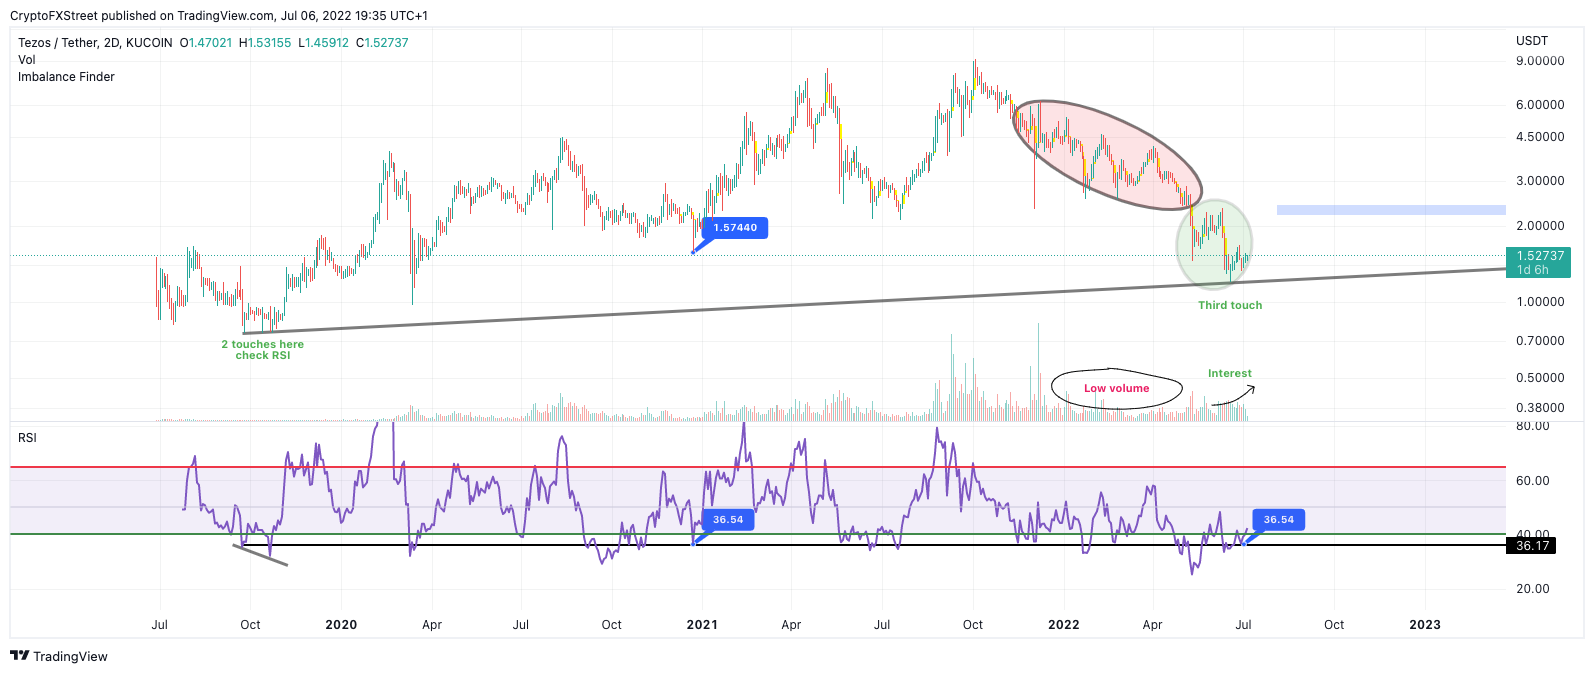
XTZ/USDT 2-Day Chart
It is worth noting that the recent bounce from the trendline on June 18, 2022, at $1.19, was simultaneously met with a double bottom signal at the 36 interval on the Relative Strength Index. This key RSI level was also triggered on Dec 24, 2020, when the XTZ price briefly fell and bottomed at $1.57. Furthermore, the interval played a leading role in the bullish divergence in 2020 when the Tezos price witnessed its’ all-time lows of $0.75
Invalidation of the bullish outlook is a closing candle below the historical ascending trendline currently positioned at $1.18 on the 2-day chart. If the bears manage to take this level out, they may be able to push the price as low as $0.75, resulting in a 50% decline from the current Tezos price.
Author

Tony M.
FXStreet Contributor
Tony Montpeirous began investing in cryptocurrencies in 2017. His trading style incorporates Elliot Wave, Auction Market Theory, Fibonacci and price action as the cornerstone of his technical analysis.


