• Shiba Inu price undergoes a bearish wave as FED official paints a dire picture of the rate path. 
  • SHIB price is further on the backfoot as quarterly earnings put investors on edge. 
  • Expect to see money flow out of SHIB, with a correction back to $0.00002200.

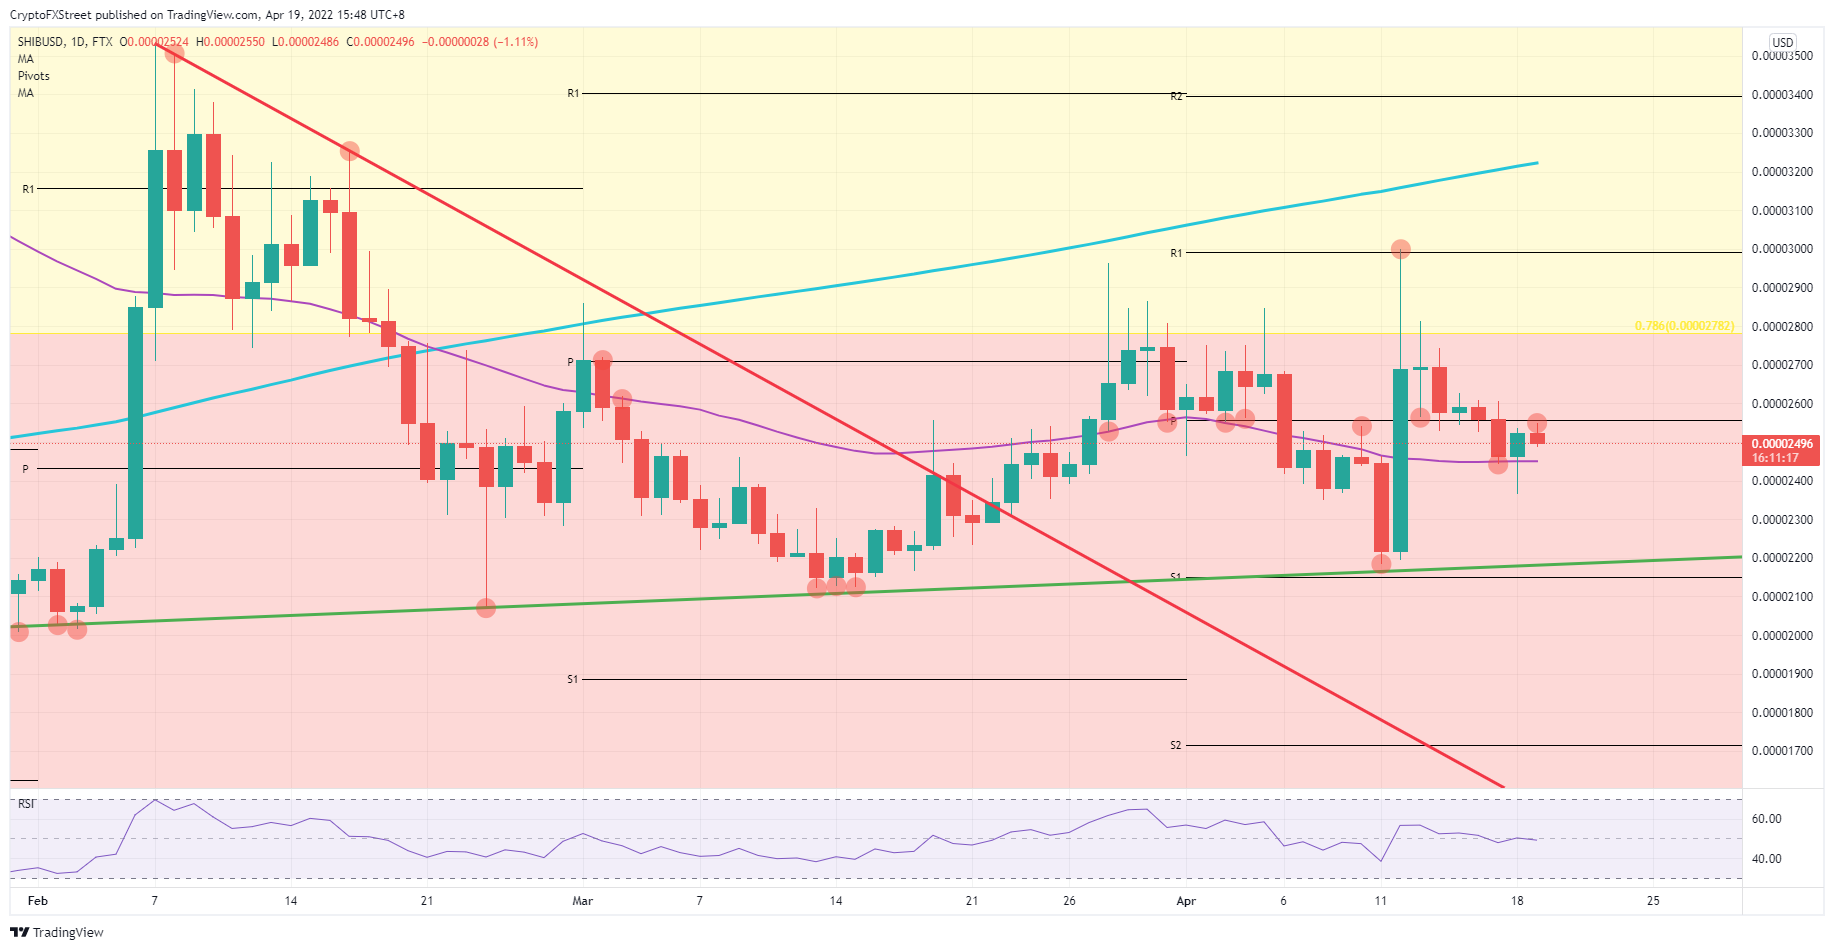
Shiba Inu (SHIB) price slips back below $0.00002600 as price action undergoes a rejection by the monthly pivot at $0.00002550 after forming a bull trap. Additionally, the Relative Strength Index (RSI) is slipping below 50, showing that investors’ interest is fading as traders are on edge due to the fact the new earnings quarter is set to kick in today, and FED comments this morning painted a possibly even more hawkish rate path for the near future. That last one is important for setting the scene of risk appetite in the coming weeks and months and is pushing SHIB price towards $0.00002200 for now, resulting in a 12% loss.

SHIB price sees investors doubting, sidelined for the proper pullback to jump in

Shiba Inu price is slipping further to the downside after bulls tried to return above the monthly pivot at $0.00002550 on Monday. Instead, bulls got hammered at the open on Tuesday as volume picked up after the bank holiday. Investors already got a rude awakening by a few comments from a FED official pointing to a 0.75% rate hike on the docket at the next FED meeting. ASIA PAC investors quickly returned their SHIB tokens for hard cash and looked to stay sidelined for a while.

SHIB price thus will bleed further into the session today and possibly for the next few days to come. Tomorrow NETFLIX will be reporting its earnings after the bell, which will be taken as a leading indicator for FAANG stocks and the Nasdaq, an event that will be closely watched. Expect investors to keep pulling their cash out of SHIB price, resulting in a 12% correction towards $0.00002200 with the longer-term green ascending trend line, the monthly pivot S1 just below and the double bottom from April 11 as trifecta for catching price action.

SHIB/USD  daily chart

SHIB/USD  daily chart

If earnings before the US opening bell point to a wave of positive news, expect to see a quick reversal in the price action. The RSI would pop back above 50, attracting more buyers and investors, and set the scene for SHIB price to jump and close above $0.00002550. With a daily close above that, the road will be paved towards $0.00002800 in the coming days, holding an 11% gain.


Information on these pages contains forward-looking statements that involve risks and uncertainties. Markets and instruments profiled on this page are for informational purposes only and should not in any way come across as a recommendation to buy or sell in these assets. You should do your own thorough research before making any investment decisions. FXStreet does not in any way guarantee that this information is free from mistakes, errors, or material misstatements. It also does not guarantee that this information is of a timely nature. Investing in Open Markets involves a great deal of risk, including the loss of all or a portion of your investment, as well as emotional distress. All risks, losses and costs associated with investing, including total loss of principal, are your responsibility. The views and opinions expressed in this article are those of the authors and do not necessarily reflect the official policy or position of FXStreet nor its advertisers. The author will not be held responsible for information that is found at the end of links posted on this page.

If not otherwise explicitly mentioned in the body of the article, at the time of writing, the author has no position in any stock mentioned in this article and no business relationship with any company mentioned. The author has not received compensation for writing this article, other than from FXStreet.

FXStreet and the author do not provide personalized recommendations. The author makes no representations as to the accuracy, completeness, or suitability of this information. FXStreet and the author will not be liable for any errors, omissions or any losses, injuries or damages arising from this information and its display or use. Errors and omissions excepted.

The author and FXStreet are not registered investment advisors and nothing in this article is intended to be investment advice.

Join Telegram

Recommended content


Recommended Content

Editors’ Picks

Why crypto may see a recovery right before or shortly after Bitcoin halving

Why crypto may see a recovery right before or shortly after Bitcoin halving

Cryptocurrency market is bleeding, with Bitcoin price leading altcoins south in a broader market crash. The elevated risk levels have bulls sitting on their hands, but analysts from Santiment say this bleed may only be cauterized right before or shortly after the halving.

More Cryptocurrencies News

Manta Network price braces for volatility as $44 million worth of MANTA is due to flood markets

Manta Network price braces for volatility as $44 million worth of MANTA is due to flood markets

Manta Network (MANTA) price was not spared from the broader market crash instigated by a weakness in the Bitcoin (BTC) market. While analysts call a bottoming out in the BTC price, the Web3 modular ecosystem token could suffer further impact.

More Manta Network News

Bitcoin price uptrend to continue post-halving, Bernstein report says as traders remain in disarray

Bitcoin price uptrend to continue post-halving, Bernstein report says as traders remain in disarray

Bitcoin is dropping amid elevated risk levels in the market. It comes as traders count hours to the much-anticipated halving event. Amid the market lull, experts say we may not see a rally until after the halving. 

More Bitcoin News

OMNI post nearly 50% loss after airdrop and exchange listing

OMNI post nearly 50% loss after airdrop and exchange listing

Omni network (OMNI) lost nearly 50% of its value on Wednesday after investors dumped the token following its listing on top crypto exchanges. A potential reason for the crash may be due to the wider crypto market slump.

More Omni Network News

Bitcoin: BTC’s rangebound movement leaves traders confused

Bitcoin: BTC’s rangebound movement leaves traders confused

Bitcoin (BTC) price has been hovering around the $70,000 psychological level for a few weeks, resulting in a rangebound movement. This development could lead to a massive liquidation on either side before a directional move is established. 

Read full analysis

BTC

ETH

XRP