Will Shiba Inu price rally to $0.00005 this week
- Shiba Inu price resets the inefficiency created due to Robinhood listing by retracing 18%.
- A breakout from $0.0000329 will trigger a 38% upswing to $0.0000454.
- If SHIB produces a daily candlestick close below $0.00000211 it will invalidate the bullish thesis.
Shiba Inu price coils up as it approaches a crucial barrier, delaying the breakout from a bottom reversal pattern. SHIB needs the go-sign from the big crypto to move this move higher or the gains are going to come undone.
Shiba Inu price needs to make a move
Shiba Inu price has been forming an Adam and Eve pattern for more than three months. Although last week suggested that a breakout might be near, SHIB slid back into consolidation. The big crypto’s lack of volatility and the dog-themed crypto’s correlation with it seem to be playing a crucial role in the sideways movement.
Regardless, Shiba Inu quickly rallied 36% after the Robinhood listing on April 12, but has retraced roughly 18% from its peak and is currently hovering around $0.0000250.
The Adam and Eve setup contains a V-shaped valley followed by a rounding bottom. This technical formation forecasts a 38% upswing, obtained by measuring the valley’s depth and adding it to the breakout point at $0.0000329.
After more than three months of price action, Shiba Inu price is yet to reach the $0.0000329 neckline to complete the said pattern. After this, a daily candlestick close above the said barrier will indicate a breakout and kick-start a move to the target at $0.0000454.
While the theoretical aspects suggest that a move to $0.0000454 is likely, there is a good chance that this rally could extend to the $0.0000500 psychological level. In total, this move would constitute an 81% upswing at $0.0000454 and 100% at $0.0000500.
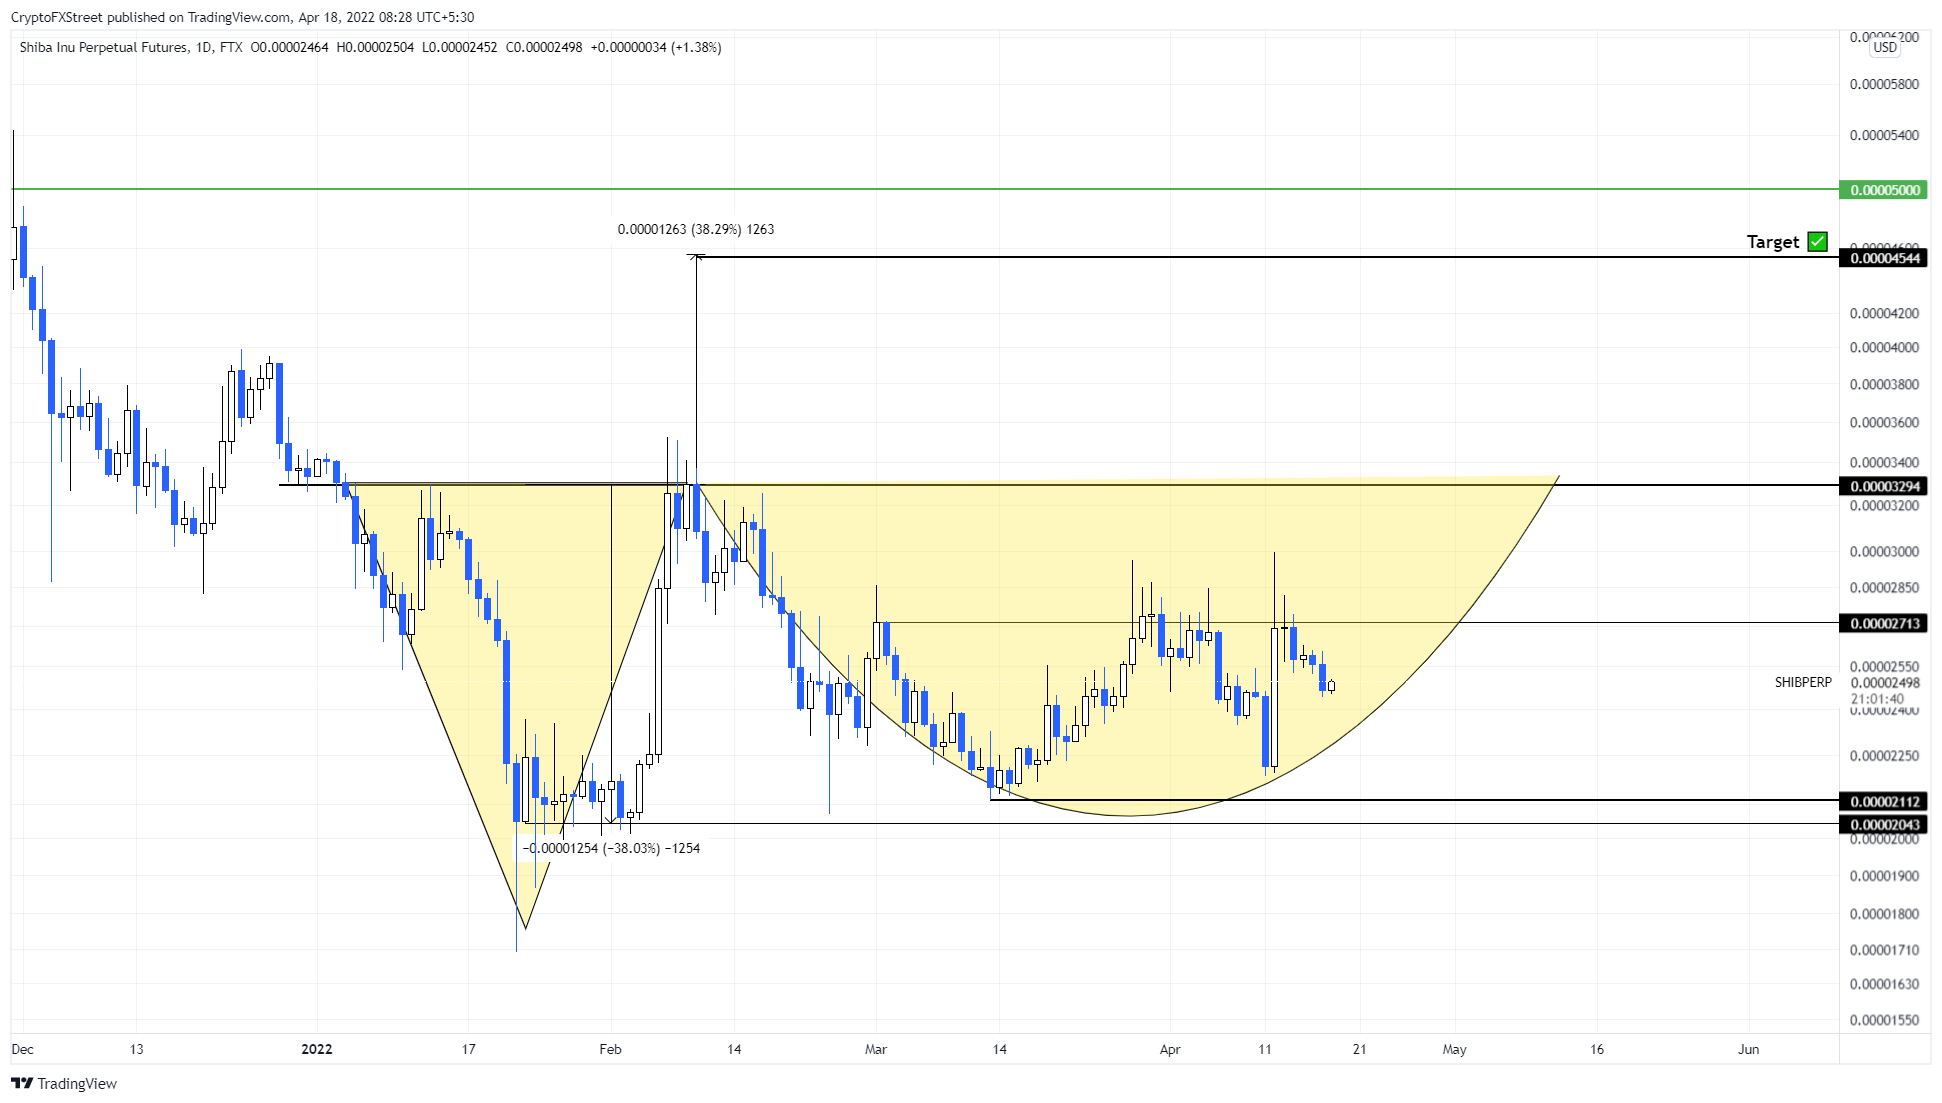
SHIB/USDT 1-day chart
While things are looking up for Shiba Inu price, the big crypto controls altcoins’ direction. If Bitcoin price nosedives, SHIB will follow suit. In such a case, a daily candlestick close below $0.0000211 will create a lower low and invalidate the bullish thesis. In such a case, SHIB might slide lower to explore a stable support level at $0.0000204.
Author

Akash Girimath
FXStreet
Akash Girimath is a Mechanical Engineer interested in the chaos of the financial markets. Trying to make sense of this convoluted yet fascinating space, he switched his engineering job to become a crypto reporter and analyst.


