This bullish pattern terrifies Ethereum competitors ahead of the Merge
- Ethereum has printed a classic bullish reversal pattern against Bitcoin in the weeks leading up to the Merge.
- Exchange reserves of Ethereum have hit a four-month low, indicating that the community is preparing to transition to Proof-of-Stake.
- Analysts have predicted a retest of $2,000 in Ethereum’s current uptrend if Bitcoin cooperates with the market sentiment.

Analysts have observed a cup-and-handle formation in the ETH-BTC price chart ahead of the transition to the Proof-of-Stake consensus mechanism. Ethereum has bullish potential to run up to $2,000 in the current uptrend.
Also read: Cardano v. Ethereum: How one transaction on Cardano covers 100s on Ethereum
Bullish chart pattern in ETH/BTC indicates breakout is imminent
After hitting a local bottom on June 13, 2022, Ethereum price recouped its losses and rebounded 40%. The ETH/BTC pair has hit its two-month high and analysts have observed a classic bullish pattern in the chart that predicts an extended rally.
Yashu Gola, a leading crypto analyst, notes the formation of a cup and handle on the lower-timeframe ETH/BTC chart since last week. A cup and handle pattern appears when an asset’s price plummets and rebounds in a U-shaped recovery, similar to a cup. When the asset’s price trends lower inside a descending channel, it is called a handle.
Once ETH/BTC pair recoups its losses and hits the same level as it held prior to the decline, the pattern is resolved.
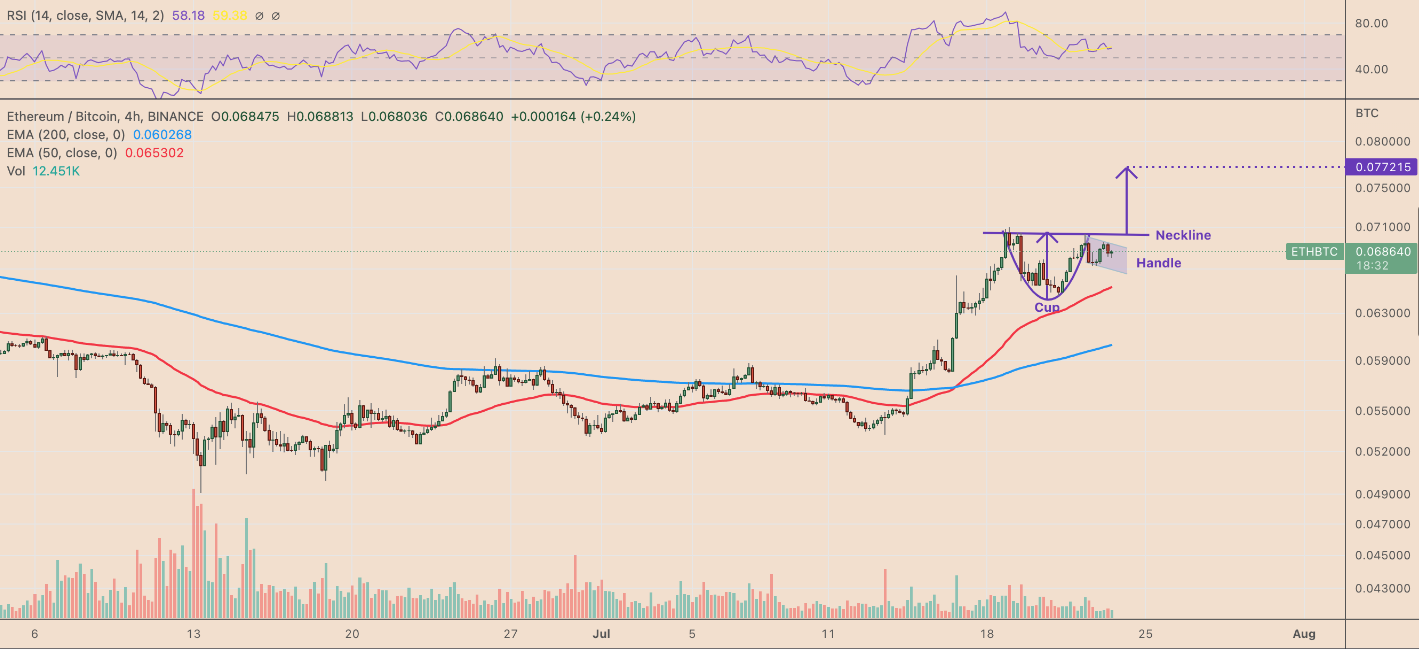
ETH-BTC price chart
Tom Bulkowski, a veteran investor, argues that the cup and handle pattern has a 61% success rate in reaching its profit target. Interestingly, the formation of the cup and handle pattern in the ETH/BTC chart was accompanied by a drop in ETH reserves across exchanges, another indicator of a rally in the altcoin.
Ethereum exchange reserves hit four year low
Based on data from the crypto intelligence platform Glassnode, Ethereum balance across exchanges hit a four-year low. The total ETH held across exchanges remained under 20 million as of July 22.
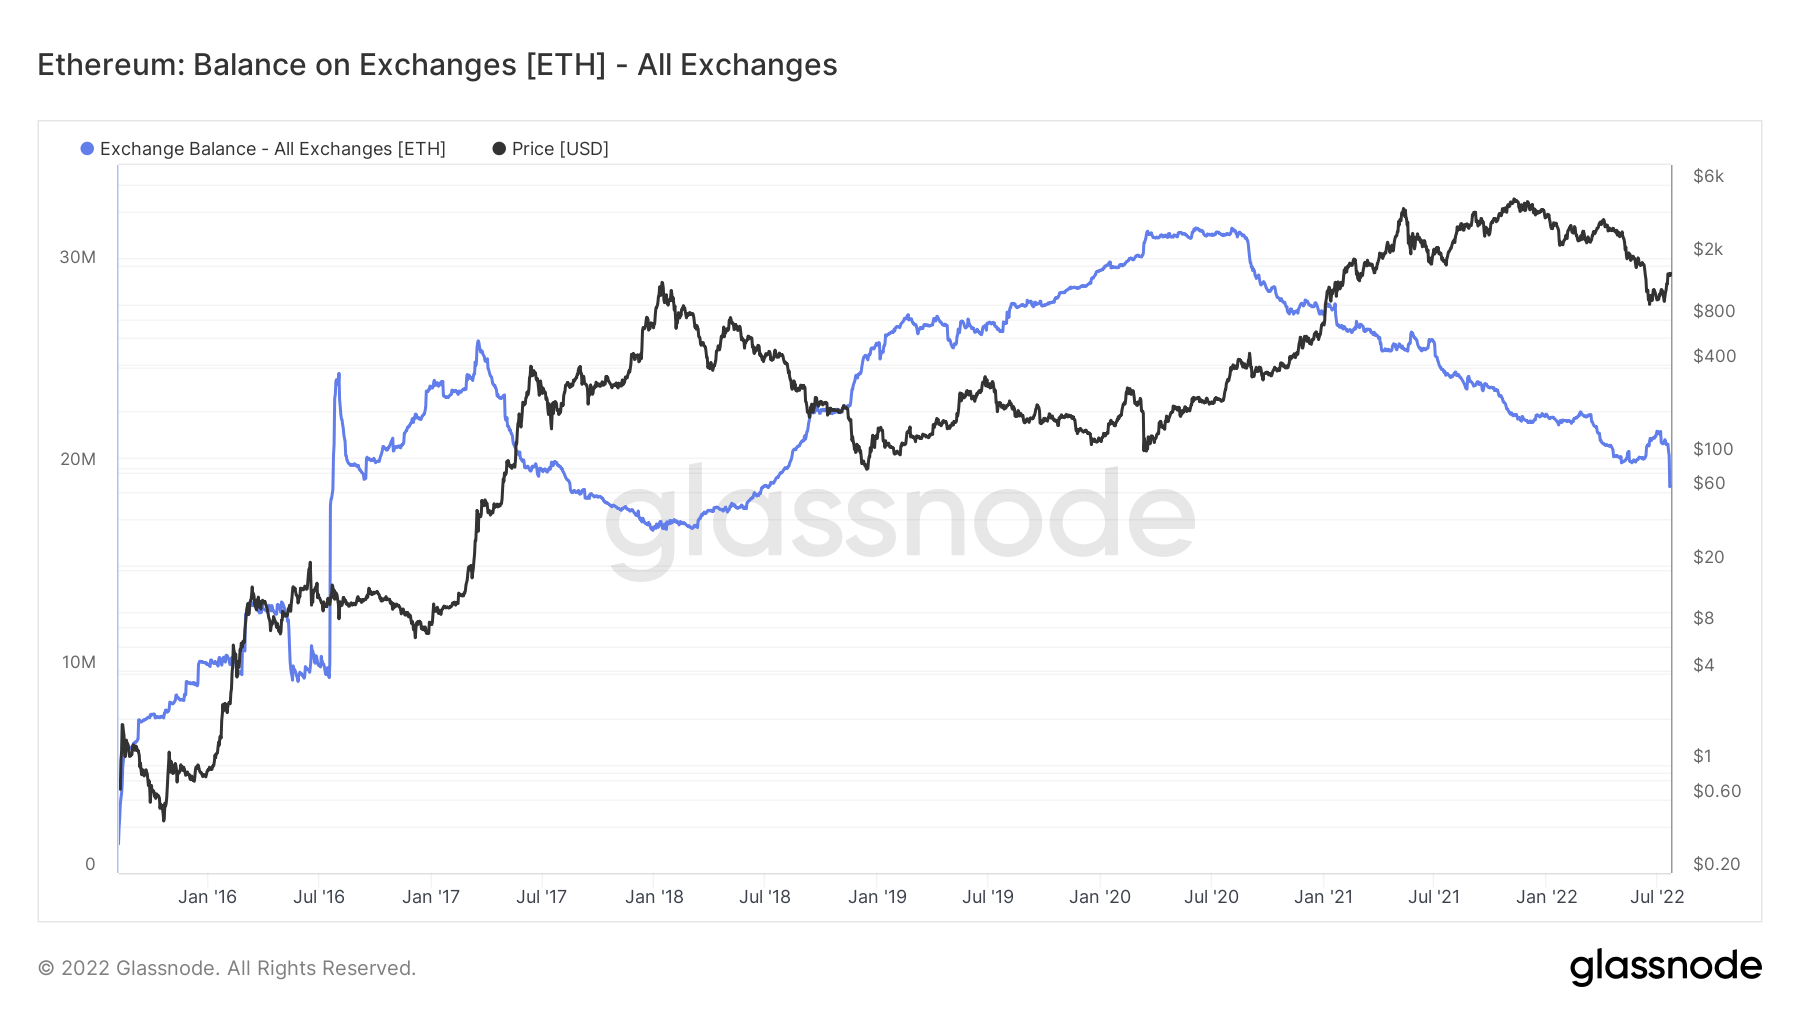
Ethereum balance across exchanges
The last time Ethereum balances across exchanges hit this level was in July 2018, it was 19.93 million. Investors are likely pulling ETH out of exchanges, in anticipation of the Merge, The transition from Proof-of-Work to Proof-of-Stake is a key event in Ethereum’s journey to lower transaction costs and higher scalability.
Vitalik Buterin, the co-founder of Ethereum has mentioned the likelihood of 100,000 transactions per second after the Merge.
Analysts predict run up to $2,000 in Ethereum price rally
FXStreet analysts have evaluated the Ethereum price trend and predicted a retest of the $2,000 level. ETH/BTC price chart revealed a bullish pattern and analysts believe a breakout in the altcoin is likely. For price levels and key chart patterns, check the video below:
Author

Ekta Mourya
FXStreet
Ekta Mourya has extensive experience in fundamental and on-chain analysis, particularly focused on impact of macroeconomics and central bank policies on cryptocurrencies.


