Theta Price Forecast: THETA sparks 20% correction
- Theta price hit a top after the second reversal signal was spotted on March 23.
- The 28% correction could extend another 20% as a stable support barrier at $11.34 gives in.
- A decisive close above $11.34 leading to a spike in buyers could trigger an upswing.

Theta price flashes two major sell signals that indicate a bearish regime is underway.
Theta price eyes a pullback
Theta price has appreciated one parabolic run after another from under $2 to almost hitting $15. Now, the market participants seem to be booking profits as major red flags develop across the board.
If the investors continue with selling THETA, this correction could prove fatal. At the time of writing, the Momentum Reversal Indicator (MRI) has flashed not one but two “cycle top” signals in the form of a red down arrow on the 4-hour chart.
This setup forecasts a one-to-four candlestick correction. Theta price retraced, and as a result, a crucial support barrier at $11.34 coinciding with the 161.8% Fibonacci retracement level was breached.
A sustained bearish pressure that keeps Theta price under this barrier could spell disaster for the cryptocurrency. In such a scenario, THETA will likely continue its descent to the immediate demand barrier at $9.64, which coincides with the 50 four-hour Simple Moving Average (SMA).
Following this, the MRI’s breakout line at $9.21, acting as an intermediary support level, will also play a pivotal role. If this zone breaks down, 127.2% Fibonacci retracement level at $8.30 will be tapped.
Adding credibility to this bearish outlook is the recently spawned “sell signal” by the SuperTrend indicator.
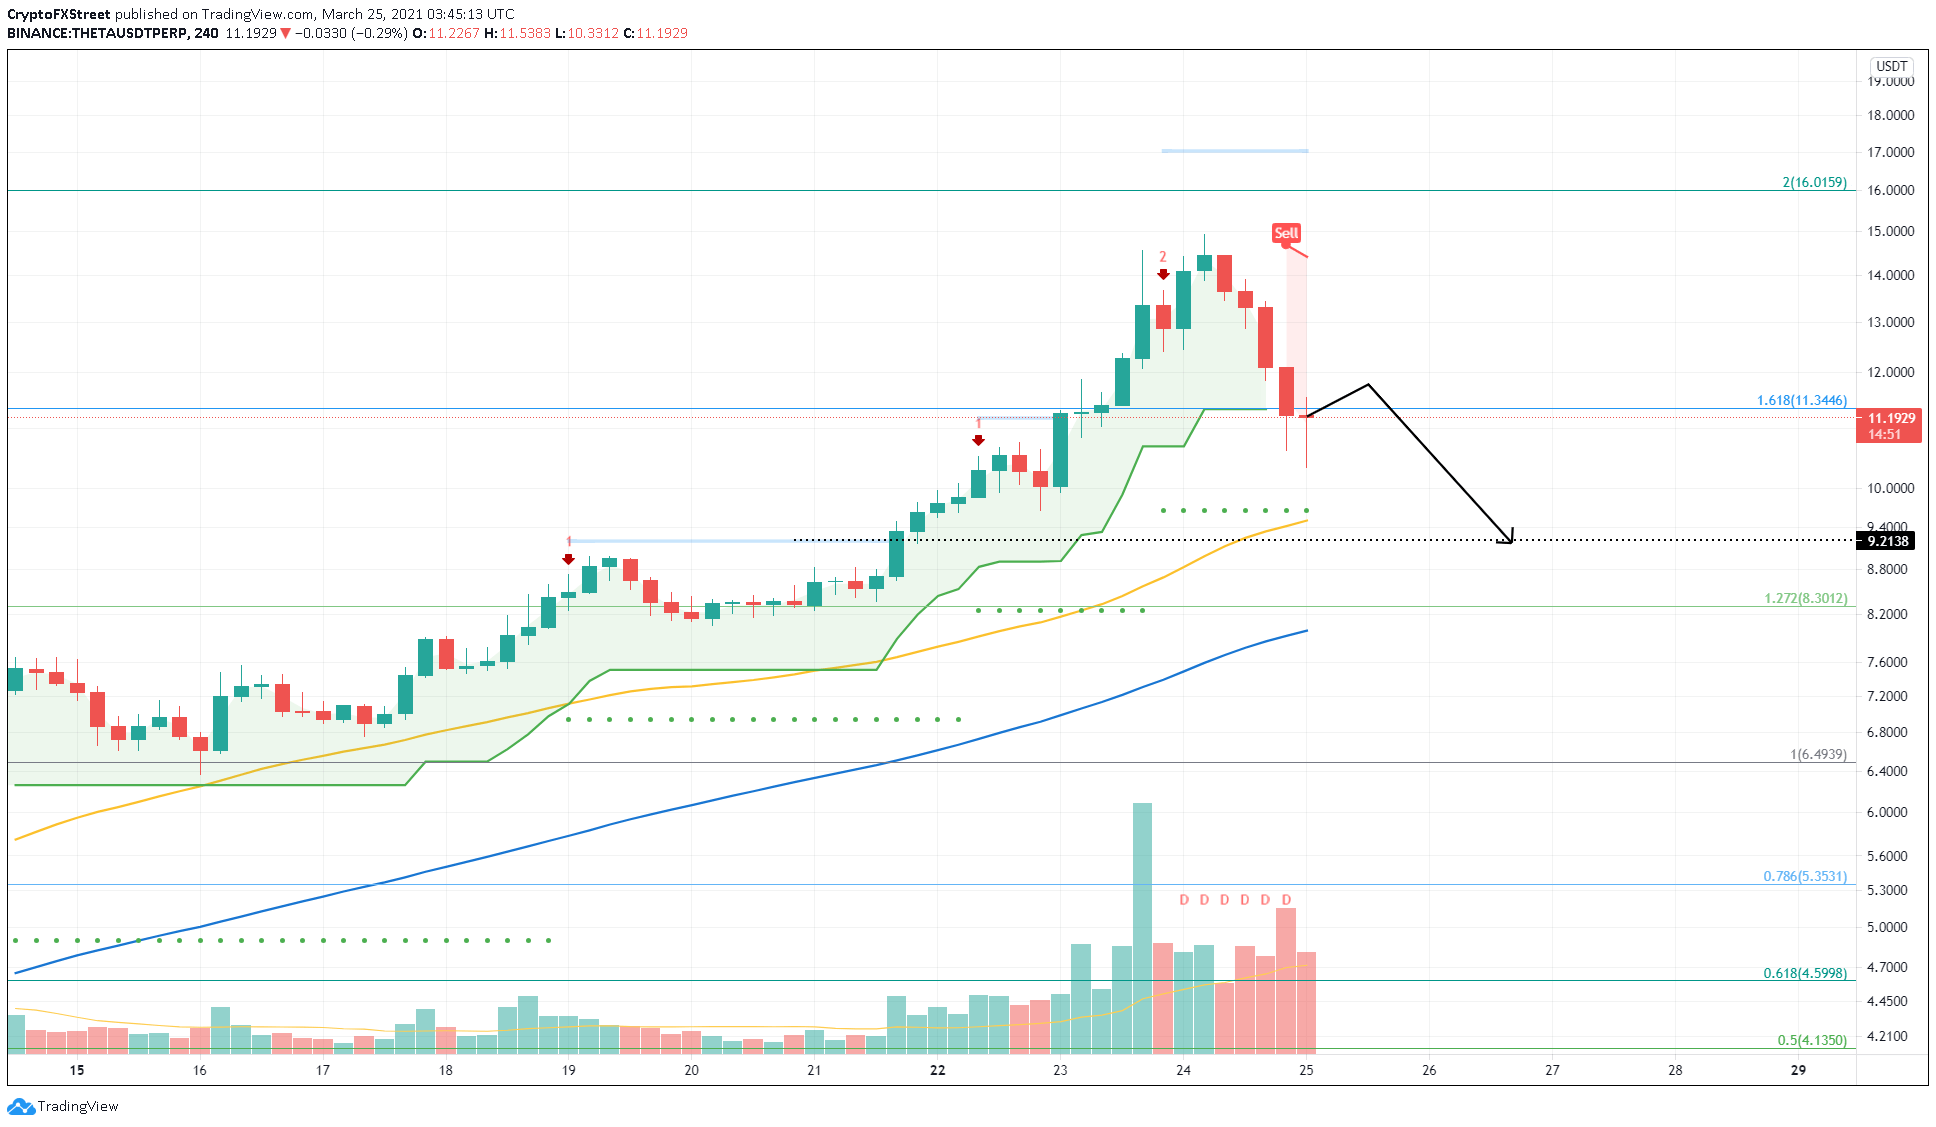
THETA/USDT 4-hour chart
Regardless of the selling pressure, if bulls manage to keep Theta price above $11.34, the pessimistic outlook can be delayed. However, a decisive close above $14.43 that creates a higher could invalidate the bearish scenario and kickstart a fresh uptrend.
If this were to happen, THETA could surge 10% to 200% Fibonacci retracement level at $16.
Author

Akash Girimath
FXStreet
Akash Girimath is a Mechanical Engineer interested in the chaos of the financial markets. Trying to make sense of this convoluted yet fascinating space, he switched his engineering job to become a crypto reporter and analyst.


