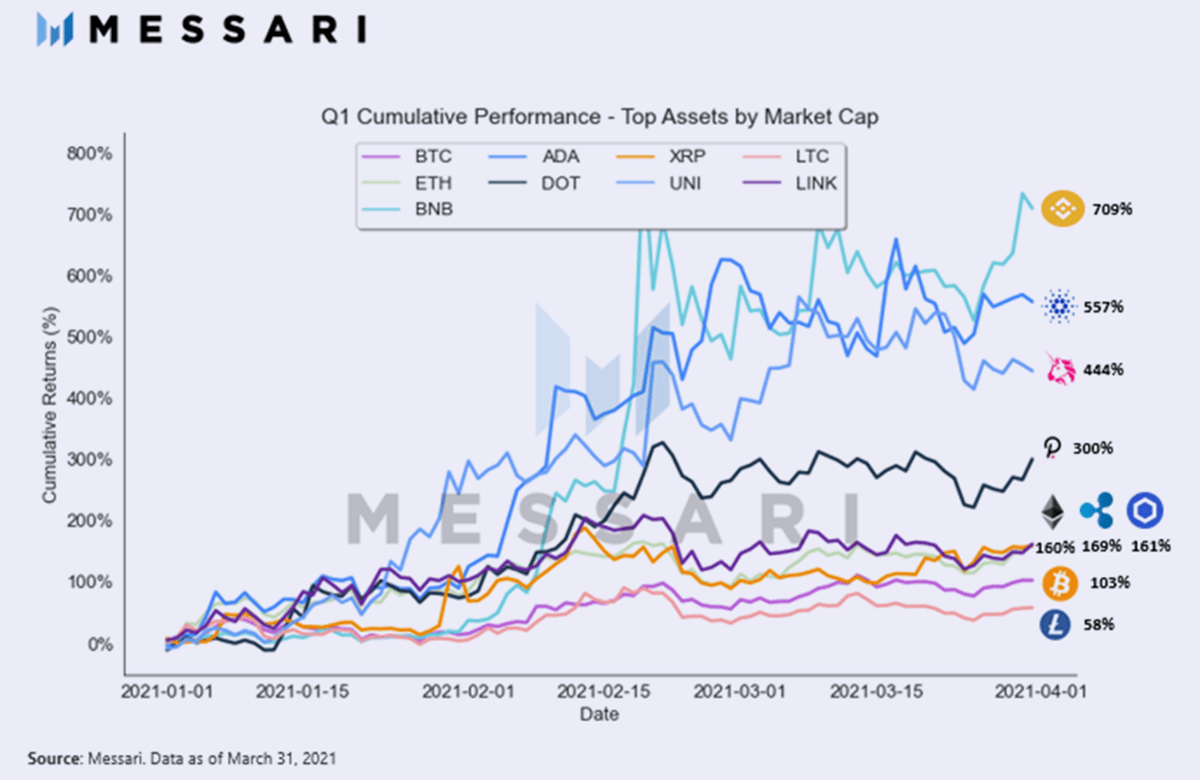
These are the top-performing cryptocurrencies of Q1 2021
- Binance Coin price rallied 709% in the first quarter and looks primed to go higher.
- Cardano price gained over 550%, and the symmetrical triangle projects higher prices.
- Uniswap price advanced 444% and voided the topping pattern yesterday.
There is no disputing that the first quarter of 2021 was a memorable period for the entire cryptocurrency complex, with massive gains in less known currencies and equally impressive gains in larger ones such as Binance Coin, Cardano, and Uniswap.
Interestingly, a dive into the charts reveals further upside potential for all three moving forward.
Binance Coin price nails short term Fibonacci levels
On March 30, Binance Coin price broke out from a symmetrical triangle continuation pattern and quickly touched the 50% measured move of the pattern at $424. Yesterday, BNB crushed the 161.8% Fibonacci extension of the February correction at $565. The chart points to the rally continuing to the 261.8% extension of the 2019-2020 bear market at $942 and even to the 261.8% extension of the February correction at $1,128 over the long term.
A brief consolidation could emerge as speculators are witnessing today, providing a timely entry point for the latecomers. Still, based on the indicators and metrics, the consolidation should be relatively mild, taking BNB down to the 23.6% retracement of the rally from the March 25 low at $502. The 38.2% retracement at $430 should contain any excess weakness.
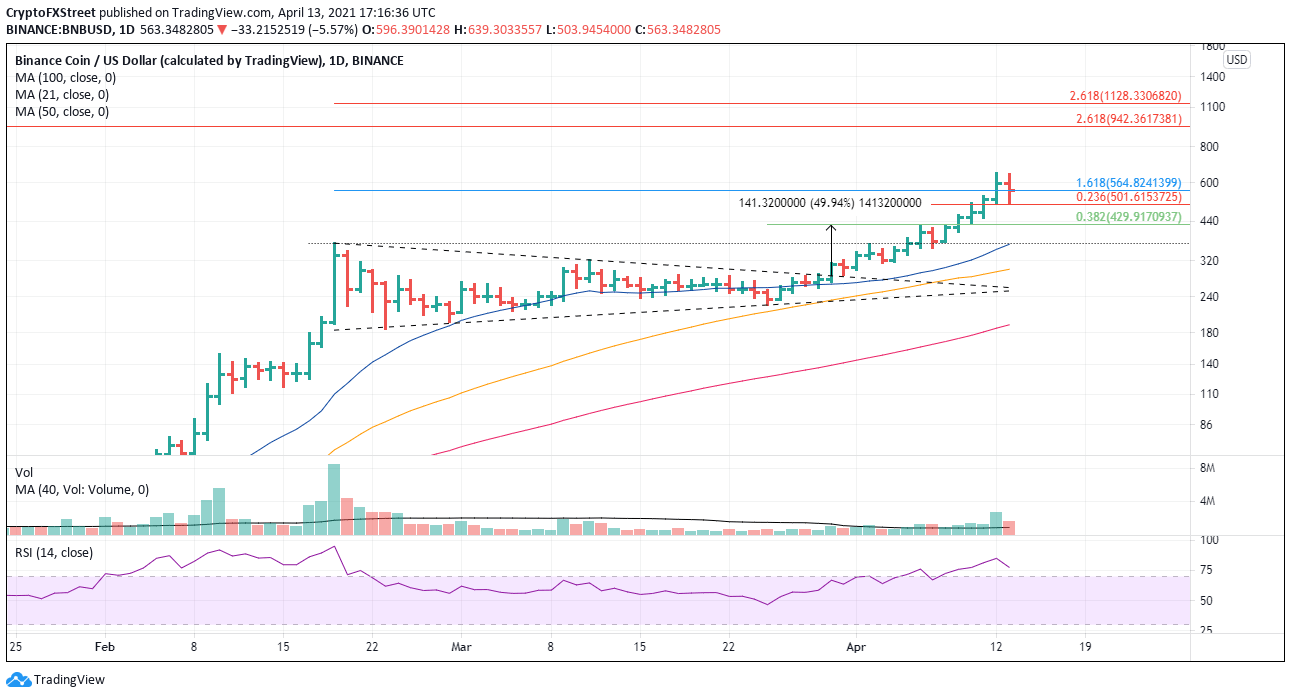
BNB/USD daily chart
Cardano price needs daily close above February high
The hottest sectors like DeFi and NFTs offer Cardano tremendous growth opportunities in the short and long term, and the price reflects that growing momentum with again of over 500% in the first quarter.
Since the February high, ADA has defined a tight symmetrical triangle just below the 2018 high at $1.40. The triangle’s measured move points to $2.05, just below the 161.8% Fibonacci extension of the February-March decline at $2.08, representing a rally of 38% from the triangle’s declining trendline at $1.48.
A more significant advance is not out of the question, and speculators should plot the 261.8% extension at $3.39 and even the 361.8% extension at $5.50 as potential profit targets following the triangle breakout.
Before the triangle can break to the downside, Cardano price needs to fight through the convergence of support at the 21-day simple moving average (SMA) at $1.20, the 50-day SMA at $1.18, and the triangle’s rising trendline at $1.17.
Lower support levels include the March 25 low at $1.02 and the March 15 low at $0.95.
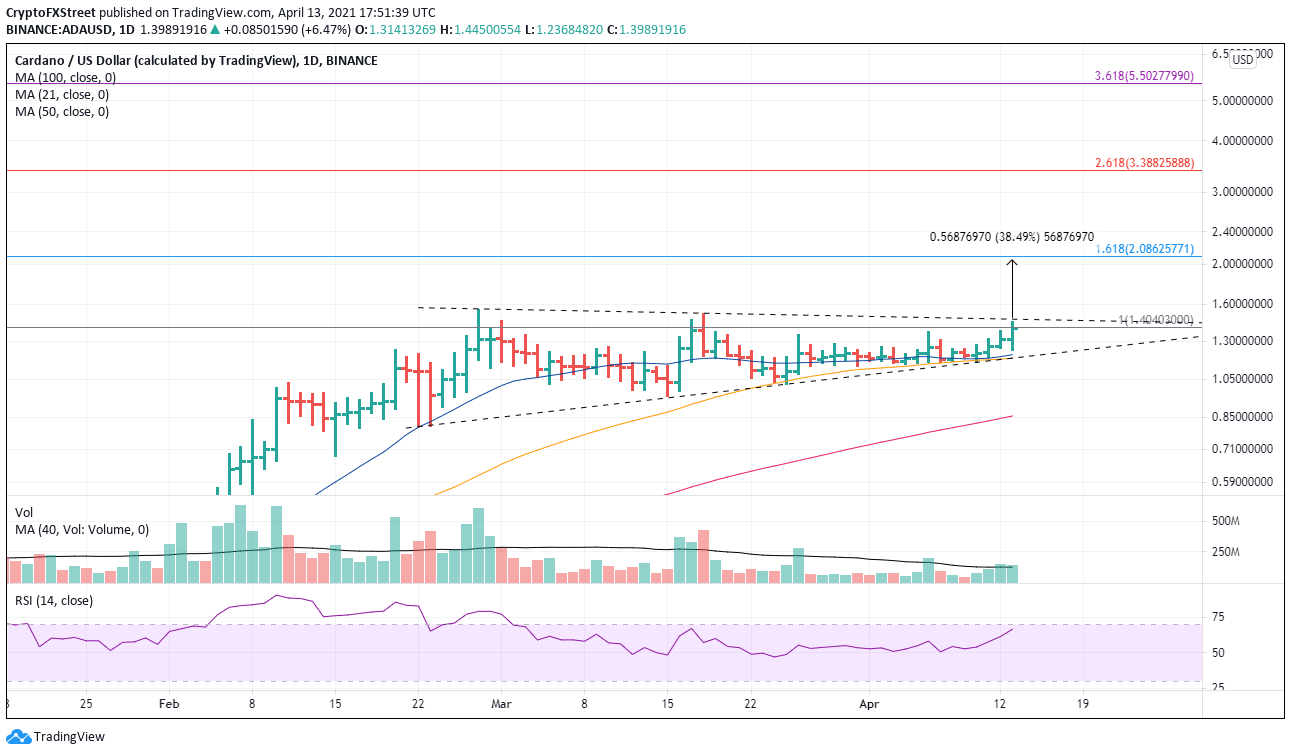
ADA/USD daily chart
Uniswap price stalling at the March high
From the February 20 high at $33.00 until yesterday, Uniswap price had been carving out a head-and-shoulders top pattern, with the right shoulder hugging the 50-day SMA. Yesterday’s rally above the right shoulder and into new highs voided the bearish pattern and has positioned UNI for a 40% gain to the topside trend line over the following days.
A successful breakout above the topside trend line will free UNI to challenge the 2.618 extension of the March correction at $57.82 and potentially the 3.618 extension at $78.96.
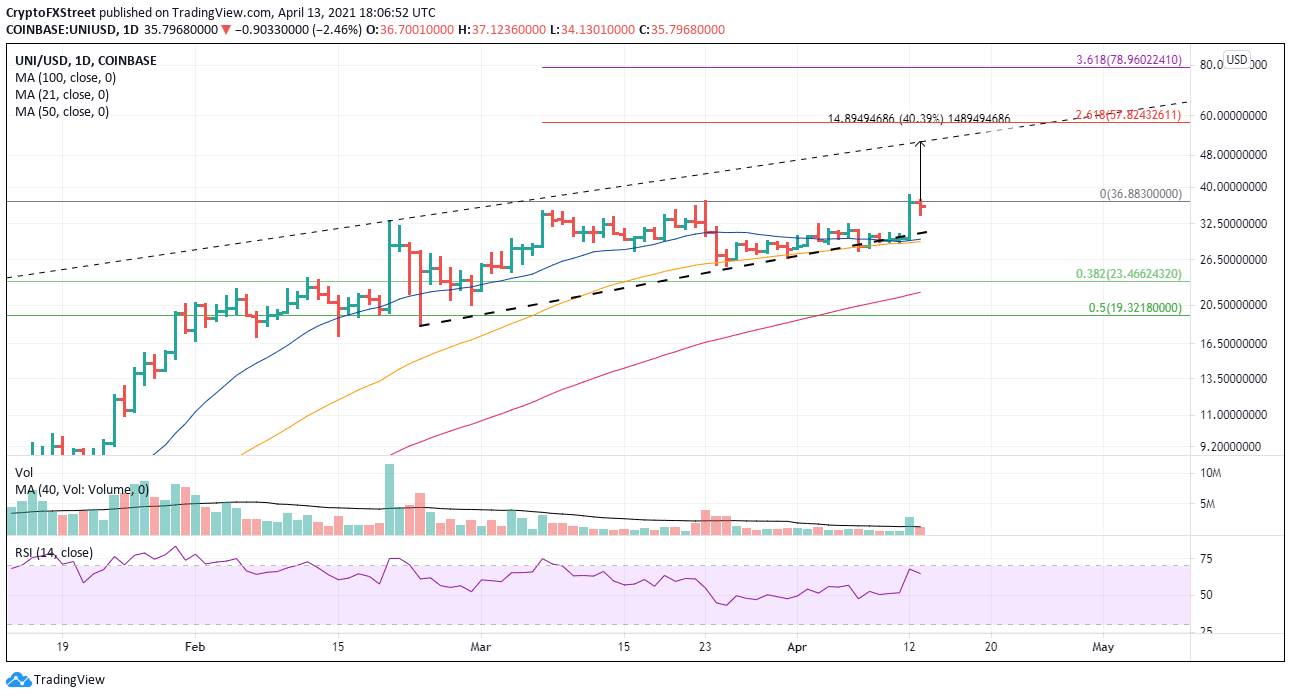
UNI/USD daily chart
A rejection at the new highs would send UNI down to the alignment of the 21-day SMA at $29.82 with the 50-day SMA at $29.40. The 38.2% retracement of the 2020-2021 bull market at $23.46 is the next level of support, followed by the 100-day SMA at $22.06.
Author

Sheldon McIntyre, CMT
Independent Analyst
Sheldon has 24 years of investment experience holding various positions in companies based in the United States and Chile. His core competencies include BRIC and G-10 equity markets, swing and position trading and technical analysis.


