The Graph price recovers pattern after GRT generates oversold signal
- The Graph price strikes resistance at the 100-day simple moving average (SMA).
- Descending triangle pattern resolves downward, creating bear trap.
- Transactional data clusters expose a large number of underwater investors above today’s high.

The Graph price triggered the bullish hammer candlestick pattern today, but gains have faded after getting near the 100-day SMA. A bullish cryptocurrency complex portends higher prices, but the GRT chart suggests that consolidation above the triangle’s lower trend line may be the scenario in the short term.
The Graph price has little room to fail
Based on the Intotheblock In/Out of the Money Around Price (IOMAP) data, The Graph price recovery may be short-lived as a wall of underwater investors are staring down from the $1.56-$1.61 price range.
Approximately 2,200 addresses that purchased 60.52 million GRT in that range are currently out of the money. The big obstacle, not surprisingly, rests between the 50-day SMA and the 100-day SMA.
Simultaneously, there is a negligible number of investors in the money to provide support, giving the current situation a bearish bias.
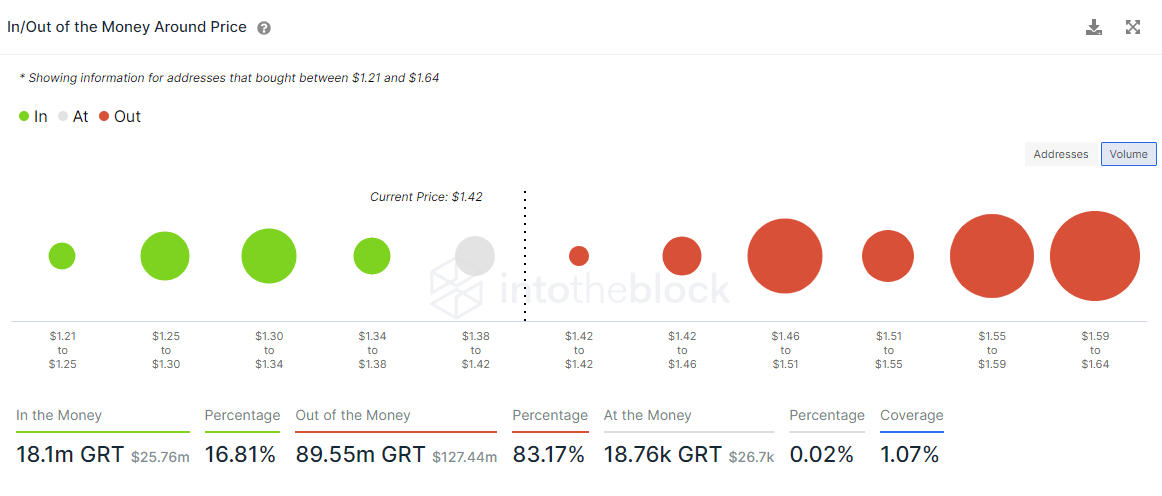
GRT IOMAP data
It is easy to be swept up in the strength of the cryptocurrency market. Still, The Graph price chart is not a highlight reel for bullish investors. As well, today’s absence of volume commitment taints the GRT outlook, raising the question of whether the triangle breakdown was simply a bear trap or a prelude to a more significant decline.
A continuation of today’s rally will find resistance at the 100-day SMA at $1.53 and then the declining 50-day SMA at $1.72. The triangle’s upper trend line is currently at $2.07, and it should be heavy resistance.
To confirm a low, GRT will need to close above the 61.8% retracement of the February-April decline at $2.22. The retracement level coincides with two important highs, March 9 at $2.21 and April 15 at $2.19.
The oversold reading on the daily Relative Strength Index (RSI) may be enough to launch GRT towards the targets mentioned above.
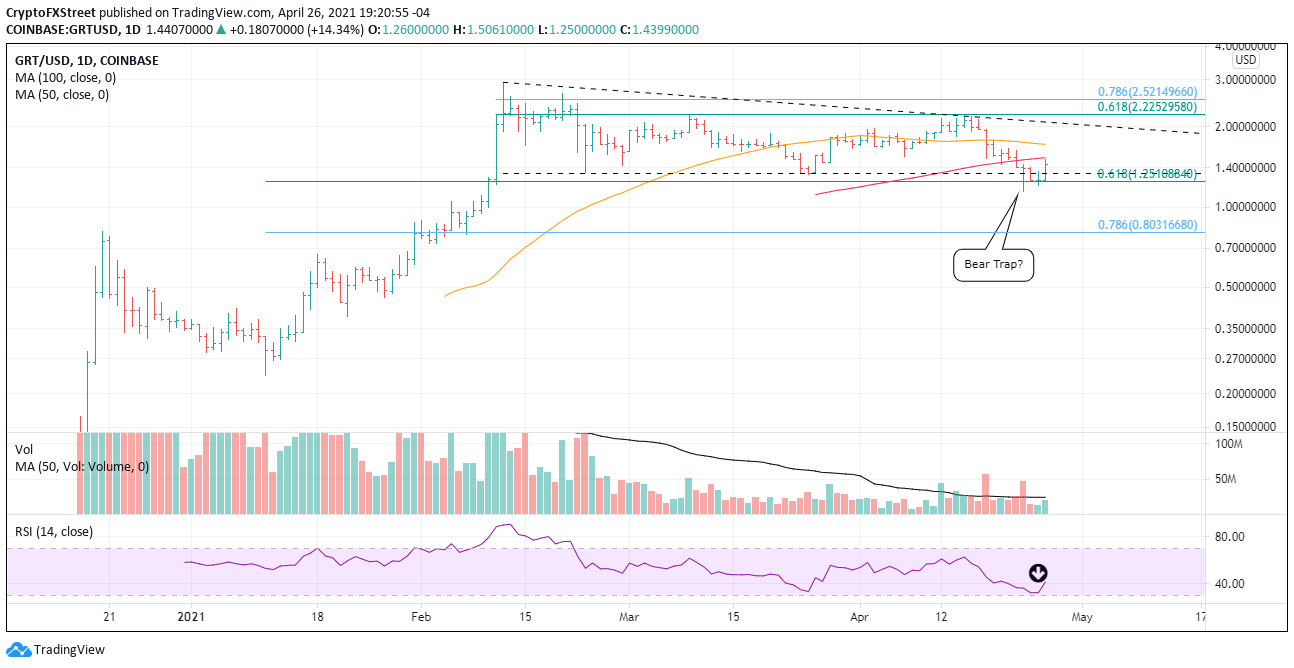
GRT/USD daily chart
The confluence of the February 23 low at $1.33 with the March 25 low at $1.31 and the 61.8% retracement of the rally from the January low at $1.25 halted the decline. If they fail to do so the second time, GRT confronts a major sell-off that could carry the altcoin to the 78.6% retracement of the rally from the January low at $0.80.
Author

Sheldon McIntyre, CMT
Independent Analyst
Sheldon has 24 years of investment experience holding various positions in companies based in the United States and Chile. His core competencies include BRIC and G-10 equity markets, swing and position trading and technical analysis.


