• Tezos price action has already rallied 62% since mid-June.
  • XTZ price sees momentum building for a breakout. 
  • Cryptosummer looks limited with seasonality and Fed warnings hanging over price action.

Tezos (XTZ) price action is printing a staggering performance in just a slim two months with 62% gains after bouncing off $1.19 and nearing $2. Momentum and the daily price chart still point to more upside potential, but traders must bear in mind that the window of opportunity is starting to close as seasonality is set to kick in, with September known as the worst performing month for cryptocurrencies over a five-year track record. Additionally, several Fed members have come out these past few days and over the weekend and said that investors should not focus on early rate cuts at the beginning of 2023, as the Fed will keep hiking until inflation is near 2%, with no forward guidance and rate hikes projections heavily dependent on economic data.

XTZ price bears another 35% of gains

Tezos price action is like other major cryptocurrencies enjoying the hot crypto summer that goes hand in hand with the equity rally. More upside is probably still on the cards but there is also an expiration date on that rally. As we near mid-August, September is just around the corner, and historical data shows that September is often a very negative month for cryptocurrencies, giving a conscious trader an edge and advantage to trade the rally profitable and get out in time.

XTZ price sees higher lows and, on the top side, bears being pushed against the monthly R1 at $1.96. With that squeeze, a pop looks inevitable and could see XTZ price quickly printing $2 and possibly $2.20 near the monthly R2 by next week. The end game of the rally will probably be at $2.60, with the monthly R3 and the 200-day Simple Moving Average (SMA) as key bearish elements limiting any upside potential. With respect to the earlier mentioned seasonal effect, that level is projected to be reached by the end of August and beginning of September, before a correction and decline will unfold back towards $1.60 with the 55-day SMA as the backbone.
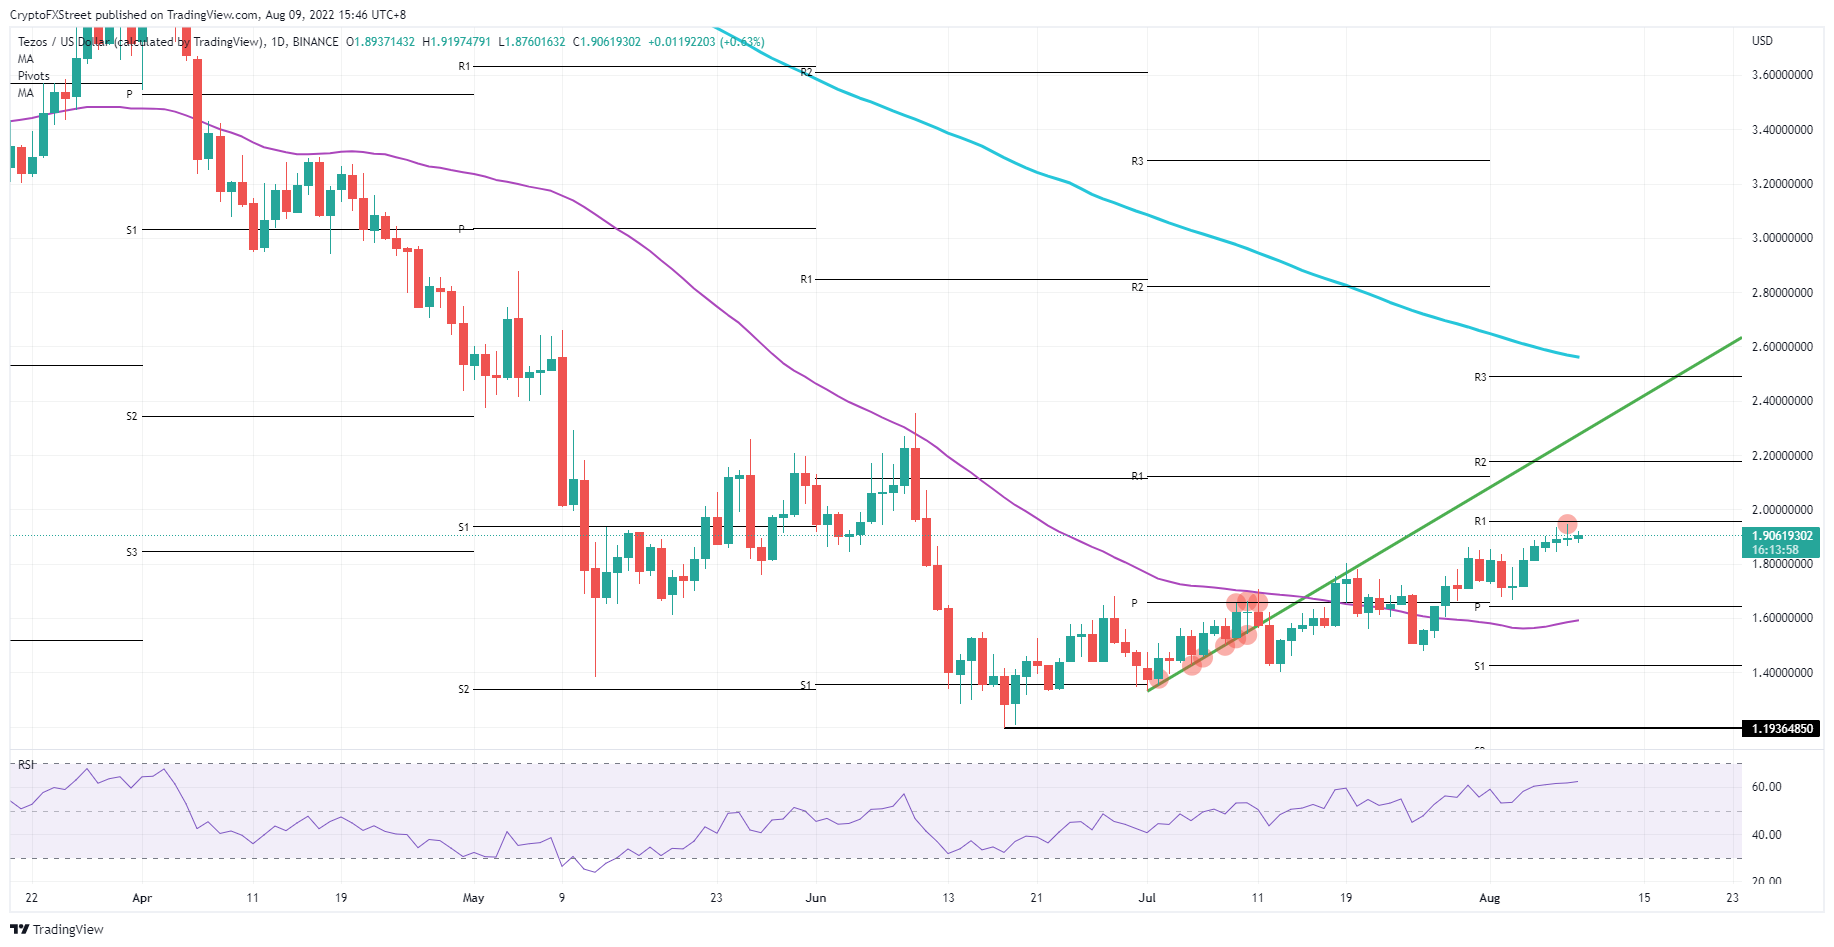
XTZ/USD Daily chart

XTZ/USD Daily chart

Possible risk to the downside could come simply from price action not being able to break through the monthly R1 at $1.96. That could coincide with remarks from Fed officials warning that markets are focusing too much on a goldilocks scenario with rate cuts in Q1 of 2023 and possible upside surprises in inflation data out of the US that would break the current risk-on sentiment. XTZ price would drop back towards the monthly pivot at $1.64, with the 55-day SMA at $1.60 as additional support to catch any falling knives.


Information on these pages contains forward-looking statements that involve risks and uncertainties. Markets and instruments profiled on this page are for informational purposes only and should not in any way come across as a recommendation to buy or sell in these assets. You should do your own thorough research before making any investment decisions. FXStreet does not in any way guarantee that this information is free from mistakes, errors, or material misstatements. It also does not guarantee that this information is of a timely nature. Investing in Open Markets involves a great deal of risk, including the loss of all or a portion of your investment, as well as emotional distress. All risks, losses and costs associated with investing, including total loss of principal, are your responsibility. The views and opinions expressed in this article are those of the authors and do not necessarily reflect the official policy or position of FXStreet nor its advertisers. The author will not be held responsible for information that is found at the end of links posted on this page.

If not otherwise explicitly mentioned in the body of the article, at the time of writing, the author has no position in any stock mentioned in this article and no business relationship with any company mentioned. The author has not received compensation for writing this article, other than from FXStreet.

FXStreet and the author do not provide personalized recommendations. The author makes no representations as to the accuracy, completeness, or suitability of this information. FXStreet and the author will not be liable for any errors, omissions or any losses, injuries or damages arising from this information and its display or use. Errors and omissions excepted.

The author and FXStreet are not registered investment advisors and nothing in this article is intended to be investment advice.

Recommended content


Recommended Content

Editors’ Picks

Solana, Sui Price Forecast: Bulls aim for steady recovery ahead of large token unlocks 

Solana, Sui Price Forecast: Bulls aim for steady recovery ahead of large token unlocks 

Solana (SOL) and Sui (SUI) altcoins are edging higher on Monday, building on the weekend gains that followed the sell-off on Friday, which was triggered by geopolitical tensions in the Middle East. 

Crypto Today: Bitcoin, Ethereum, XRP rebound along with surge in open interest, trading volumes 

Crypto Today: Bitcoin, Ethereum, XRP rebound along with surge in open interest, trading volumes 

Cryptocurrencies are broadly recovering on Monday, extending gains from the weekend, which followed instability and heightened volatility on Friday as geopolitical tensions exploded in the Middle East.

Meme Coins Price Prediction: DOGE, SHIB, and PEPE rise as broader crypto market recovers

Meme Coins Price Prediction: DOGE, SHIB, and PEPE rise as broader crypto market recovers

Dogecoin holds at critical support, ticking up after five consecutive days of losses. Shiba Inu begins the week regaining strength and targeting a key resistance trendline. Pepe’s trend reversal gains momentum in the 4-hour chart.

Bitcoin recovers above $107,000, yet Israel-Iran conflict clouds bullish outlook

Bitcoin recovers above $107,000, yet Israel-Iran conflict clouds bullish outlook

Bitcoin increases to around $107,000 on Monday after a slight decline in the previous week. Investors remain on edge as the Israel-Iran conflict enters its fourth day after fresh strikes over the weekend.

Bitcoin: BTC could slump to $100K amid Trump-Musk tussle

Bitcoin: BTC could slump to $100K amid Trump-Musk tussle

Bitcoin (BTC) tumbled to a low of $101,095 on Friday amid volatility in the market. The effect of the tussle between United States (US) President Donald Trump and Tesla Chief Elon Musk negatively influenced the NASDAQ and Tesla's stock price on Thursday, although both are recovering on Friday.

The Best brokers to trade EUR/USD

The Best brokers to trade EUR/USD

SPONSORED Discover the top brokers for trading EUR/USD in 2025. Our list features brokers with competitive spreads, fast execution, and powerful platforms. Whether you're a beginner or an expert, find the right partner to navigate the dynamic Forex market.

BTC

ETH

XRP