- Terra price downtrend hits its elastic limit around the $1.52 support level.
- LUNA price eyes a 30% bullish trend reversal from a recently completed double-bottom pattern.
- A buy signal from the MACD illuminates buyers having the upper hand and may quickly propel LUNA price to $2.11.
Terra price is attempting a recovery after bulls overwhelmed bears at support established around $1.52 earlier on Monday. Bulls eye liftoff to $1.80, but a technical projection based on the governing chart pattern may stretch the breakout 30% higher to $2.11.
Meet Terra’s new governance bot
Stakeholders behind Terra, a blockchain platform powered by LUNA, are working around the clock to stabilize the embattled token - in a bid to attract investors for a positive shift in price. Frequent software updates and new programs and applications confirm the team’s efforts.
On Monday, Terra’s team announced via Twitter the launch of a new governance bot designed to keep users up-to-date with the latest governance activities in the ecosystem. The bot will send notifications when a new post has been published “on the Governance and Proposals section of Agora” and when a new proposal advances into the voting period on the Terra Station.
Terra’s governance bot will also send an alert 48 hours before the proposal voting deadline and another notification when the proposal voting period ends – and the results are out.
How to position yourself for a Terra price rally
Terra price is nurturing a bullish trend reversal at $1.62, with demand for the token expected to increase as the Moving Average Convergence Divergence (MACD) sends a buy signal. Traders should closely follow the position of the 12-day Exponential Moving Average (EMA) above the 26-day EMA to corroborate its anticipated move past the double-bottom pattern’s neckline.
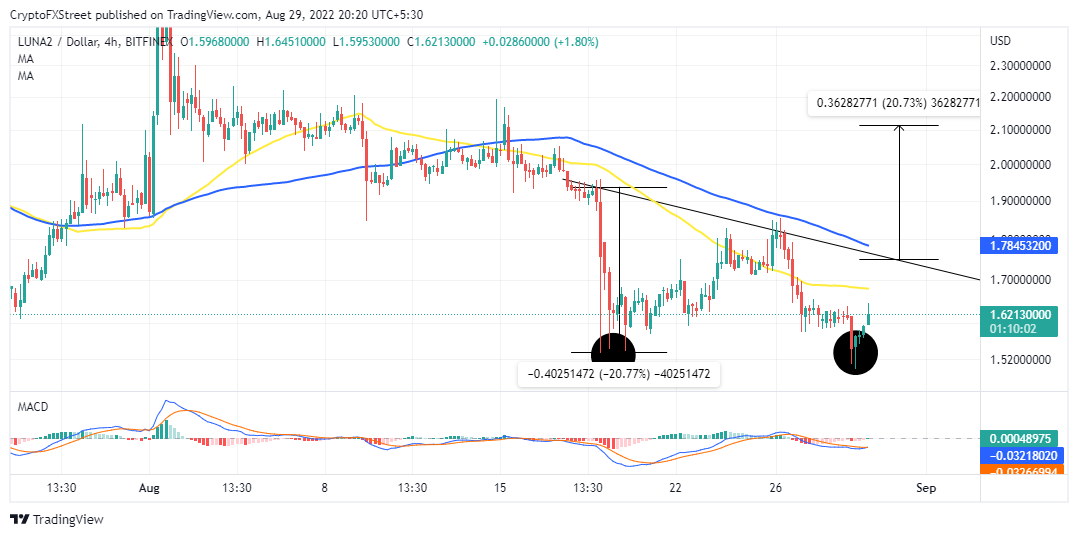
LUNA/USD four-hour chart
A double-bottom pattern occurs after a drawn-out downtrend and is characterized by two valleys (bottoms). These two troughs represent an area with an immense concentration of bulls – explaining the projected upside move. The price must, however, break above the neckline, at the high of the peak separating the two troughs, to affirm further movement – 20% in the case of Terra price.
On the other hand, caution must be exercised to avoid bull traps. Early profits can be taken at the 50-day Simple Moving Average (SMA). If Terra price cracks through neckline the resistance at $1.88, there may be enough technical backing to hold on till $2.11.
Information on these pages contains forward-looking statements that involve risks and uncertainties. Markets and instruments profiled on this page are for informational purposes only and should not in any way come across as a recommendation to buy or sell in these assets. You should do your own thorough research before making any investment decisions. FXStreet does not in any way guarantee that this information is free from mistakes, errors, or material misstatements. It also does not guarantee that this information is of a timely nature. Investing in Open Markets involves a great deal of risk, including the loss of all or a portion of your investment, as well as emotional distress. All risks, losses and costs associated with investing, including total loss of principal, are your responsibility. The views and opinions expressed in this article are those of the authors and do not necessarily reflect the official policy or position of FXStreet nor its advertisers. The author will not be held responsible for information that is found at the end of links posted on this page.
If not otherwise explicitly mentioned in the body of the article, at the time of writing, the author has no position in any stock mentioned in this article and no business relationship with any company mentioned. The author has not received compensation for writing this article, other than from FXStreet.
FXStreet and the author do not provide personalized recommendations. The author makes no representations as to the accuracy, completeness, or suitability of this information. FXStreet and the author will not be liable for any errors, omissions or any losses, injuries or damages arising from this information and its display or use. Errors and omissions excepted.
The author and FXStreet are not registered investment advisors and nothing in this article is intended to be investment advice.
Recommended Content
Editors’ Picks
Ripple's move above this key level could trigger nearly 50% rally for XRP
Ripple has overcome a critical resistance level and flipped into a support floor on the weekly time frame. This development happened while XRP tightly consolidated for roughly 250 days. Investors can expect XRP to kickstart a massive rally.
Optimism price outlook with nearly $90 million worth of OP tokens flooding markets on Friday
Optimism volatility has shrunk in the ours leading to the network’s cliff unlock. It joins the likes of dYdX and Sui, which have similar events on their calendars. As token unlocks are often considered bearish catalysts, investors should brace for a reaction after the event.
Top 3 Price Prediction Bitcoin, Ethereum, Ripple: Retail watches from the sidelines with a bias for shorts
Bitcoin could clear $73,777 peak as BTC bulls resurface. Ethereum might fall 10% before next leg up as ETH RSI teases with sell signal. XRP could lose $0.6000 threshold as Ripple bulls fail to show up.
Jito price could hit $6 as JTO coils up inside this bullish pattern
Jito price action shows a potential cup and handle formation. Based on theoretical measurement rules, a successful breakout could yield a 56% rally to $6.0. A breakdown of the $3.86 support level would create a lower low for JTO and invalidate the bullish thesis.
Bitcoin: BTC may have recovered, but is it out of the woods?
Bitcoin’s (BTC) upward momentum has shown a significant decline for the past two weeks or so. This development led to a bearish signal on the weekly and an uncertain outlook on the monthly.