Technical analysis: Will the ETH/USD price reverse its retreating?

Ethereum/USD technical analysis summary
Sell Stop: Below 3250.15.
Stop Loss: Above 3370.40.
| Indicator | Signal |
| RSI | Neutral |
| MACD | Sell |
| MA(200) | Sell |
| Fractals | Sell |
| Parabolic SAR | Buy |
| Fibonacci | Sell |
Ethereum/USD chart analysis
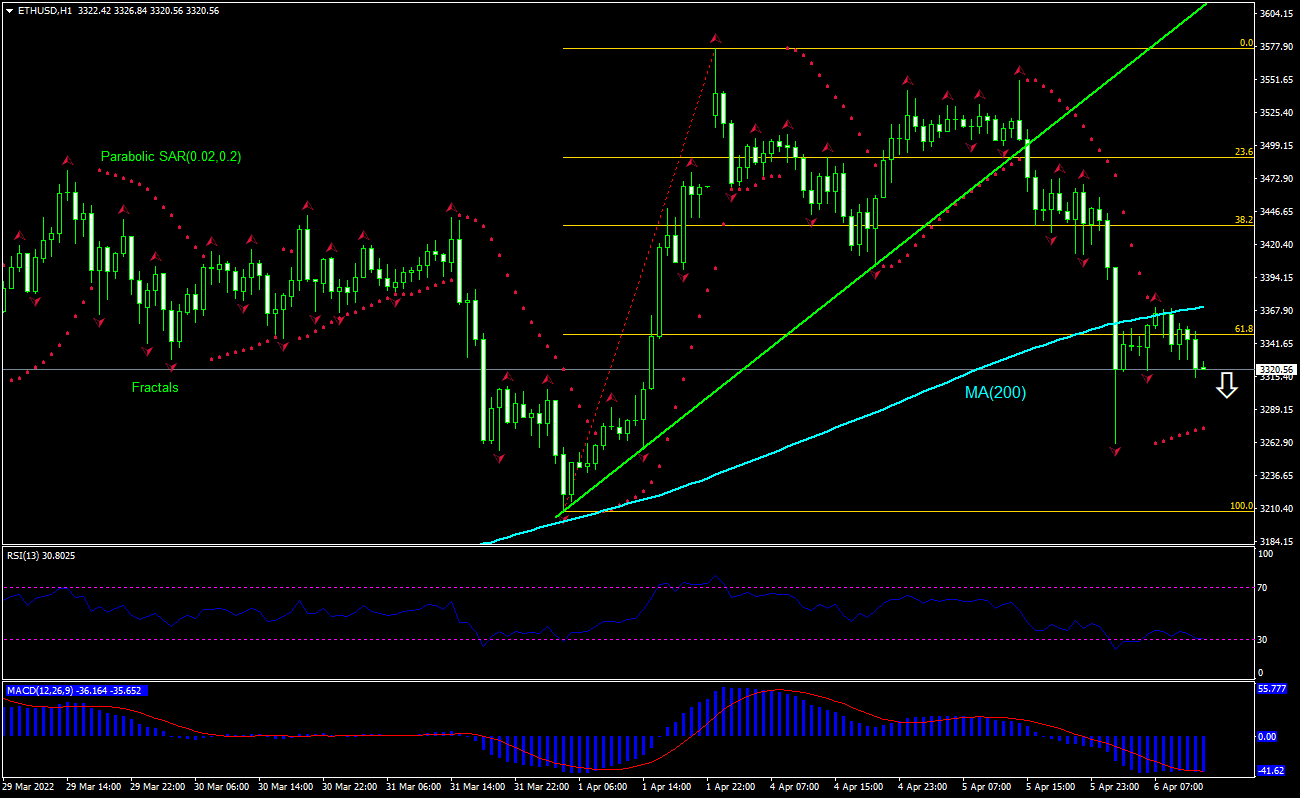
The ETHUSD technical analysis of the price chart on 1-hour timeframe shows ETHUSD: H1 has breached below the 200-period moving average MA(200) following a breach below the support line after multiple tests of. We believe the bearish momentum will continue after the price breaches below 3250.15. A level below this can be used as an entry point for placing a pending order to sell. The stop loss can be placed above 3370.40. After placing the order, the stop loss is to be moved to the next fractal high indicator, following Parabolic signals. Thus, we are changing the expected profit/loss ratio to the breakeven point. If the price meets the stop loss level without reaching the order, we recommend cancelling the order: the market has undergone internal changes which were not taken into account.
Fundamental analysis of crypto - Ethereum/USD
Ethereum gas fees fell by 90% in 6 months. Will the ETHUSD price reverse its retreating?
The average gas fee on the Ethereum network is currently $5.81, 90% less than the average charged in November 2021, according to crypto data intelligence platform Santiment. A drop in transaction fees is bullish for a crypto price. However the current setup is bearish for ETHUSD.
Want to get more free analytics? Open Demo Account now to get daily news and analytical materials.
Want to get more free analytics? Open Demo Account now to get daily news and analytical materials.
Author

Dmitry Lukashov
IFC Markets
Dimtry Lukashov is the senior analyst of IFC Markets. He started his professional career in the financial market as a trader interested in stocks and obligations.


