Waves Price Prediction: WAVES/USDT primed for a rally towards $10 mark
- WAVES/USDT is teasing a falling wedge breakout on the 12H chart.
- RSI points north while within the bullish region.
- WAVES/USDT probes 21-SMA amid bullish RSI.

Waves (WAVES/USDT) extends the rebound from near $5 into the third straight session on Friday, anticipating additional gains amid a constructive technical outlook, depicted by the 12-hour chart.
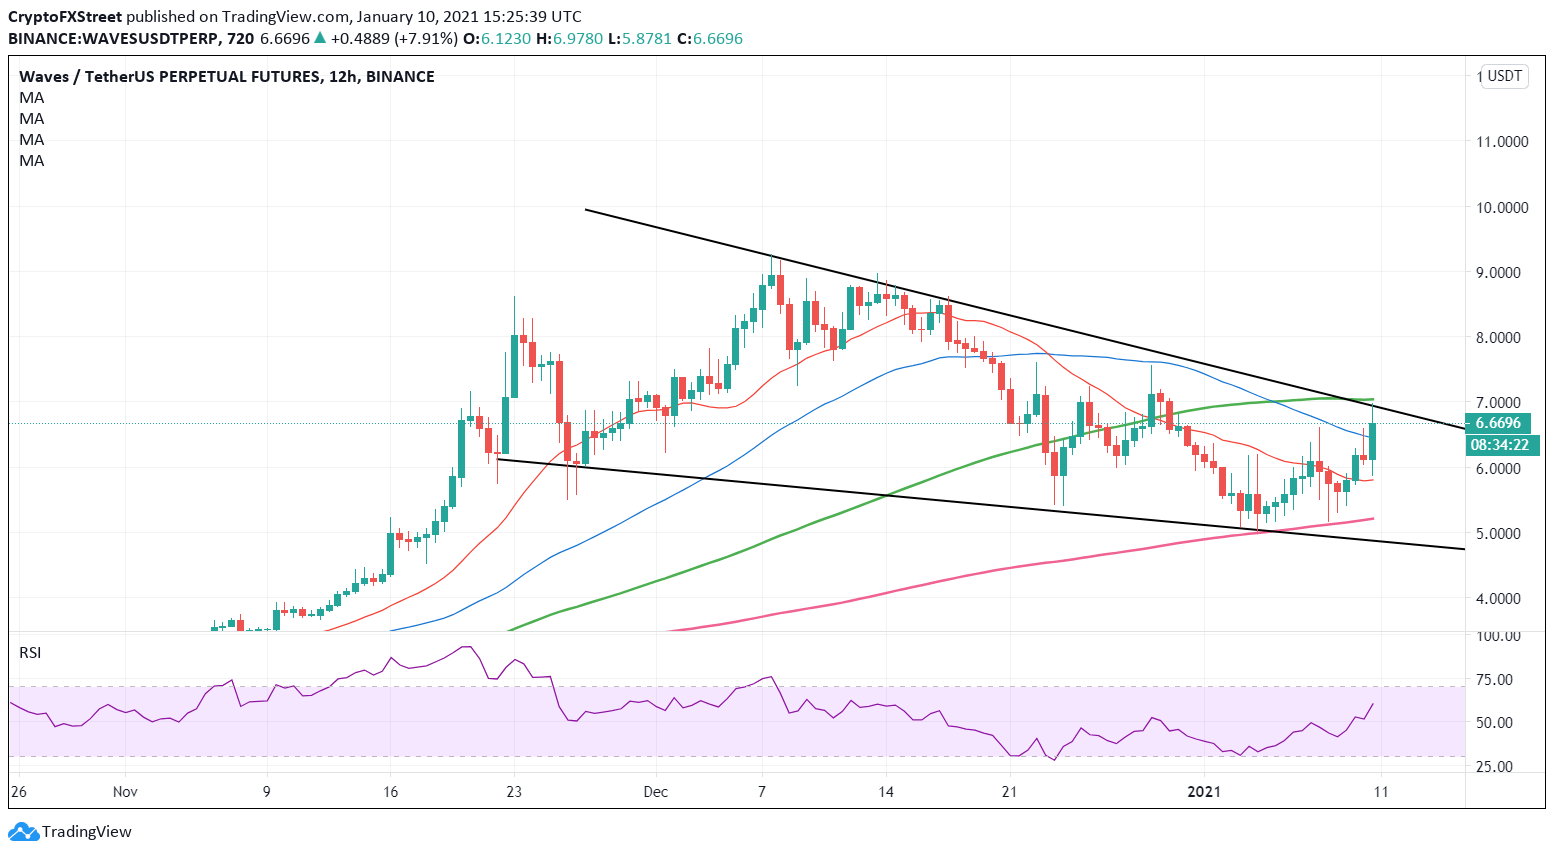
WAVES/USDT: 12-hour chart
WAVES/USDT is on the verge of breaking out from a five-week-old falling wedge formation on the said time frame.
The bulls need to make a sustained move above the critical barrier at around $7, which is the convergence of the falling trendline resistance and 100-simple moving average.
On an upside break, the coin could eye a massive upswing towards the $10 threshold.
However, if the buyers fail to find their footing above the $7 resistance area, a pullback towards the bearish 50-SMA at $6.40 remains on the cards.
Should the downside pressure intensify, the 21-SMA support at $5.80 could be put to test.
The bullish 200-SMA $5.21 could be the final cap that could rescue the Waves bulls.
To conclude, the upside appears more compelling for Waves, as suggested by the bullish Relative Strength Index (RSI), which looks north around 60.10.
Author

Dhwani Mehta
FXStreet
Residing in Mumbai (India), Dhwani is a Senior Analyst and Manager of the Asian session at FXStreet. She has over 10 years of experience in analyzing and covering the global financial markets, with specialization in Forex and commodities markets.


