Solana Price Forecast: SOL flags downside risk as ETF, retail demand eases
- Solana recovers 4% on Monday after Sunday’s 6% drop, bringing last week's loss to a staggering 14%.
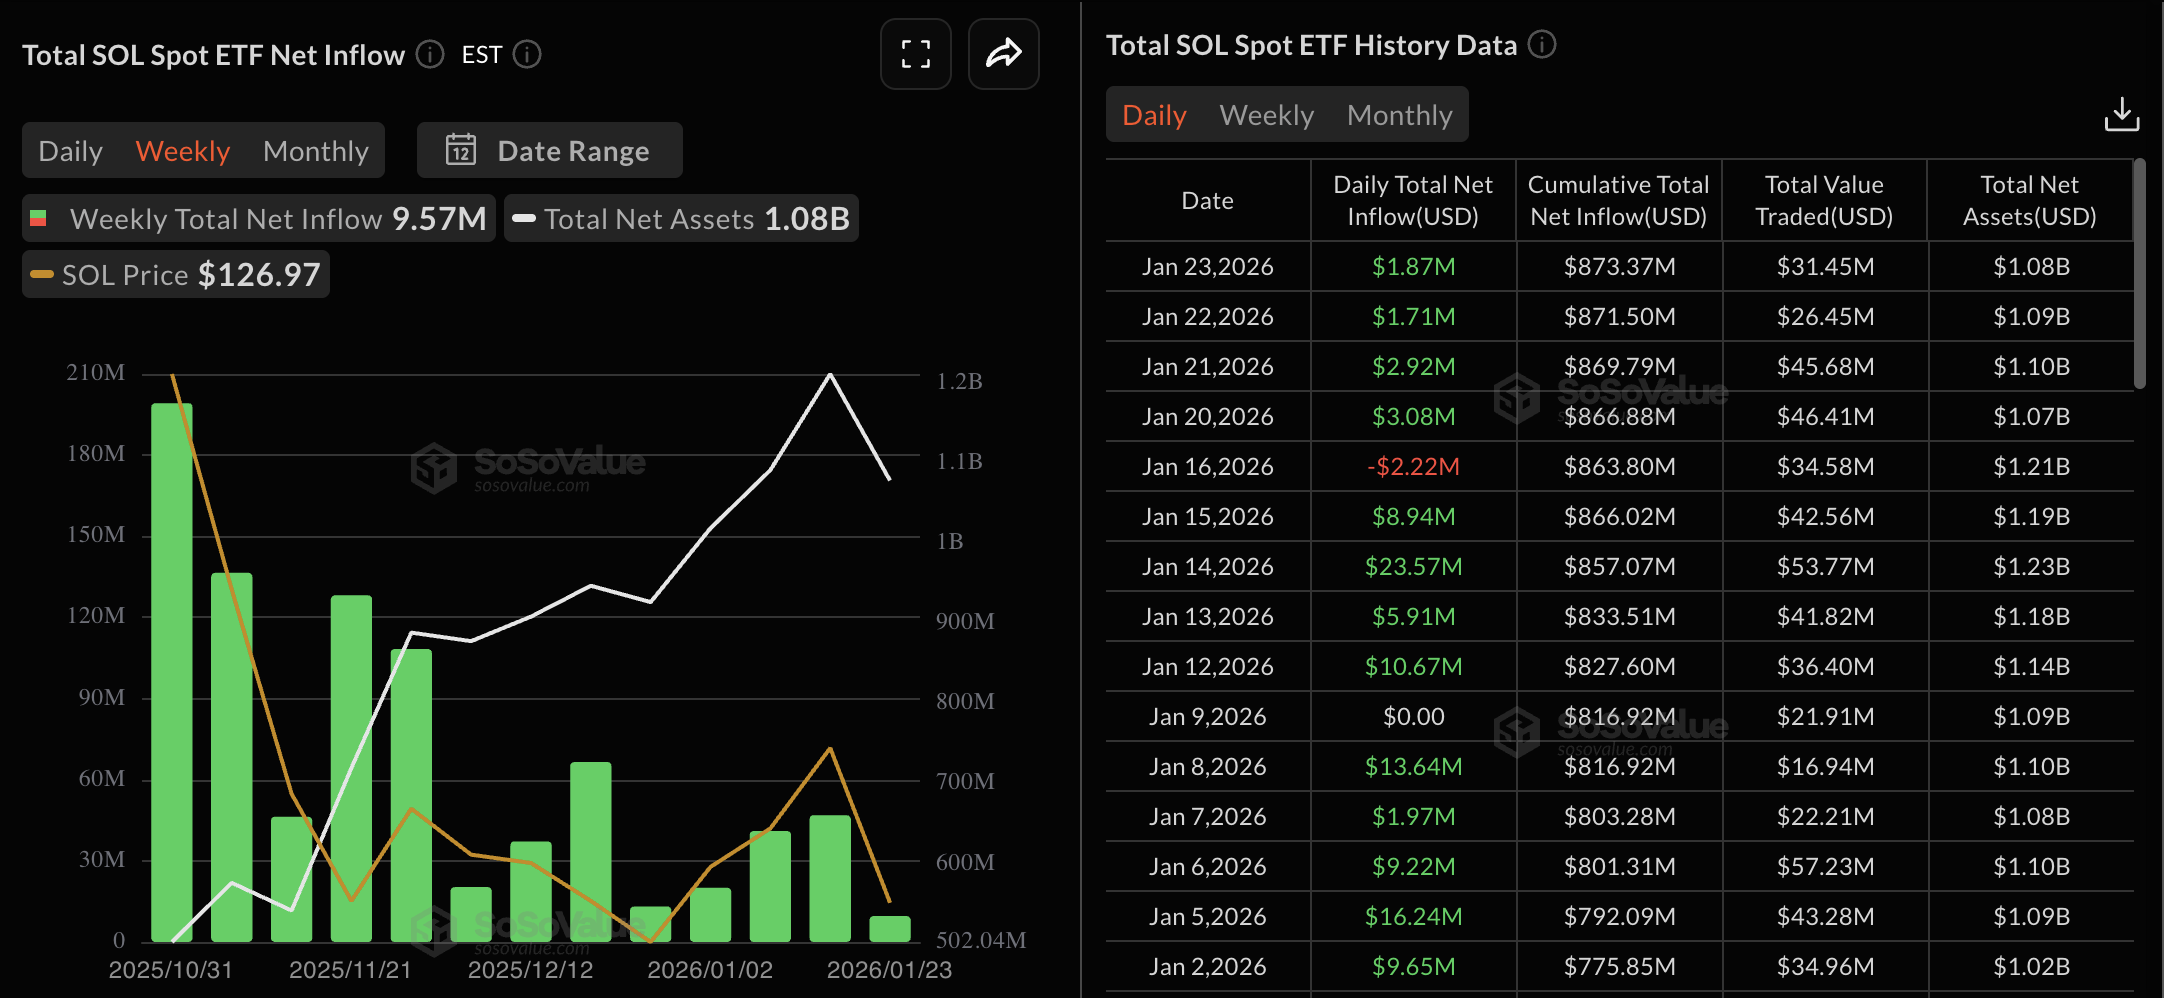
- Institutional demand for Solana is easing as US spot SOL ETFs record their lowest weekly inflow of $9.57 million.
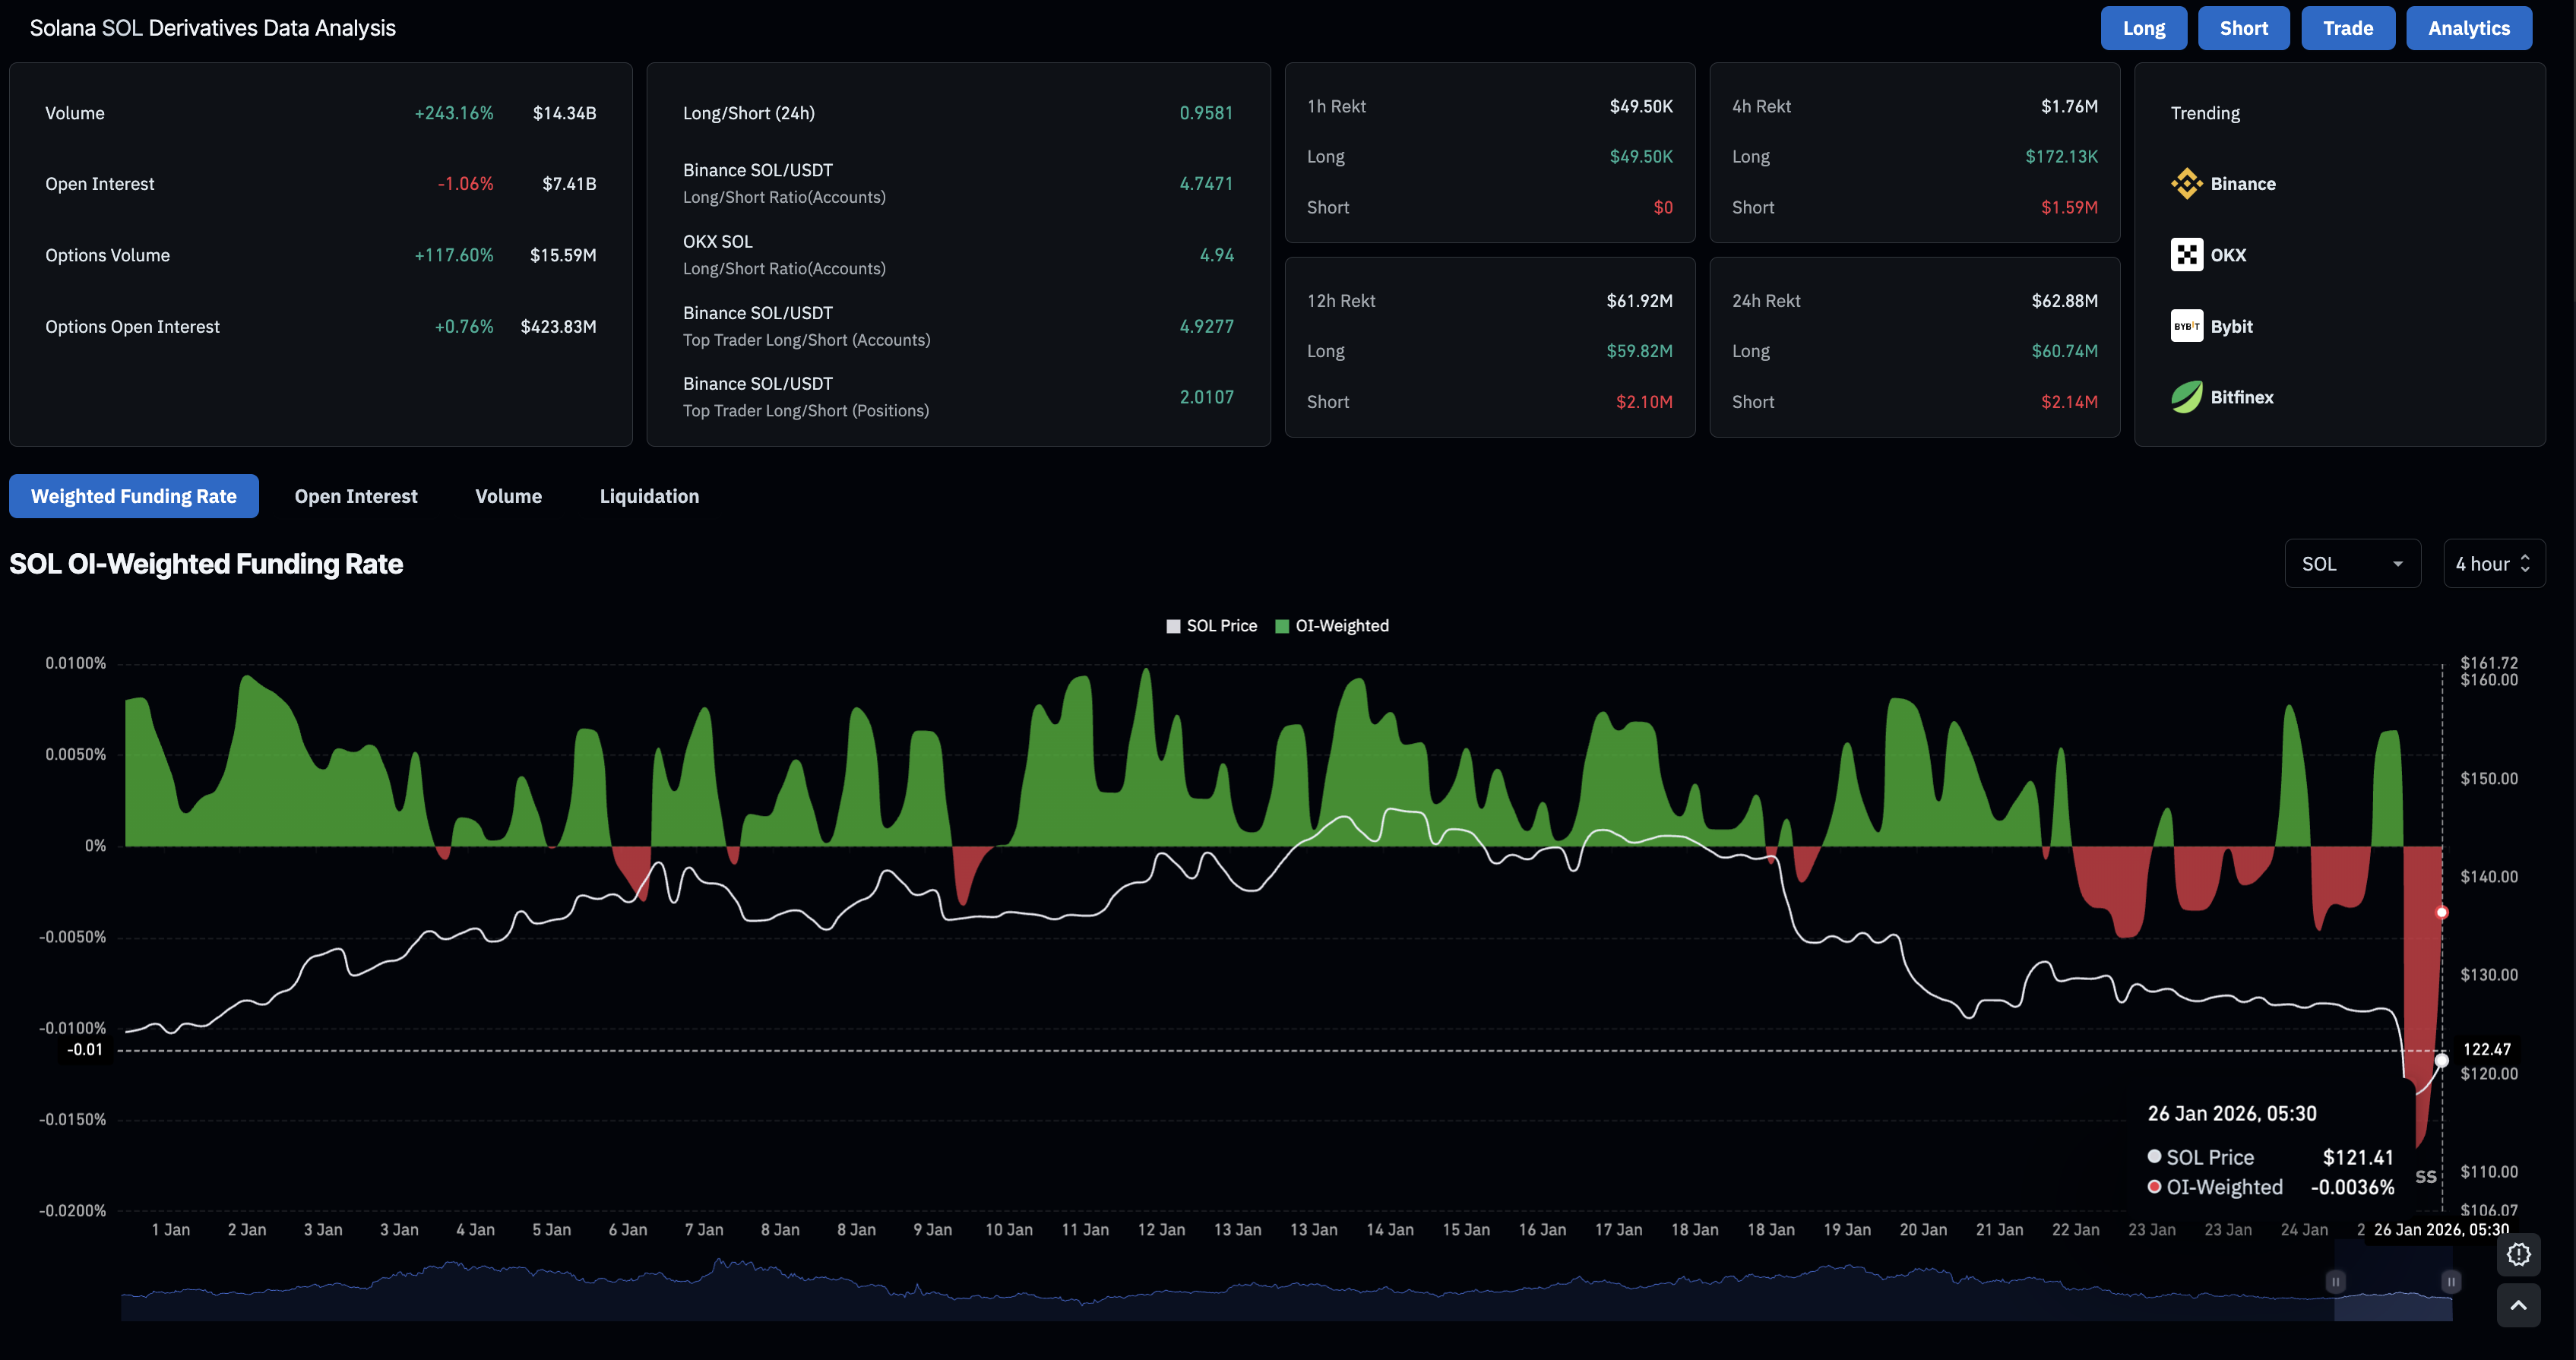
- Solana loses retail demand with over $60 million of long liquidations in the last 24 hours.

Solana (SOL) is up 4% at press time on Monday after a 6% decline on Sunday, but remains under pressure from the 14% loss last week. The pullback aligns with the reduced demand from institutional and retail investors, evidenced by falling inflows and Open Interest, while long liquidations of over $60 million in the last 24 hours reflect a bullish wipeout.
The technical outlook for Solana focuses solely on the December low at $117 and the $100 psychological support level as selling pressure increases.
Solana’s institutional and retail demand cools down
The US spot SOL Exchange Traded Funds (ETFs) recorded the lowest weekly inflows of $9.57 million, down from $46.88 million the previous week. A drop in inflows refers to reduced inflows from institutional investors amid a broader market risk-off sentiment, likely spooked by persistent geopolitical and tariff-related threats from the US. Additionally, the rise of the Japanese Yen amid speculations of its central bank's intervention to halt its decline could send the crypto market into a tailspin.
On the derivatives side, demand softens as long liquidations of over $60 million outpace short liquidations of $2.14 million over the last 24 hours, reaffirming the selling bias. The SOL futures Open Interest (OI) is down 1% to $7.41 billion, indicating a reduced value of outstanding contracts as bullish positions are wiped out and new positions tilt bearish, as evidenced by the negative funding rate of -0.0036%.
Technical outlook: Will Solana’s recovery avoid a drop to $100?
Solana is recovering quickly on Monday, rising 4% in the Asian session and approaching $125. Still, SOL holds well below the downward-sloping 50-, 100-, and 200-day Exponential Moving Averages (EMAs), reinforcing a bearish alignment.
The 50-day EMA at $135 would likely cap initial rebounds, while the 100-day EMA at $144 acts as the next barrier.
The Moving Average Convergence Divergence (MACD) histogram remains negative but is contracting, suggesting a cooldown in downside momentum. Both the MACD and signal lines sit below zero, keeping the broader bias weak.
The Relative Strength Index (RSI) is at 38, indicating soft momentum without oversold conditions.
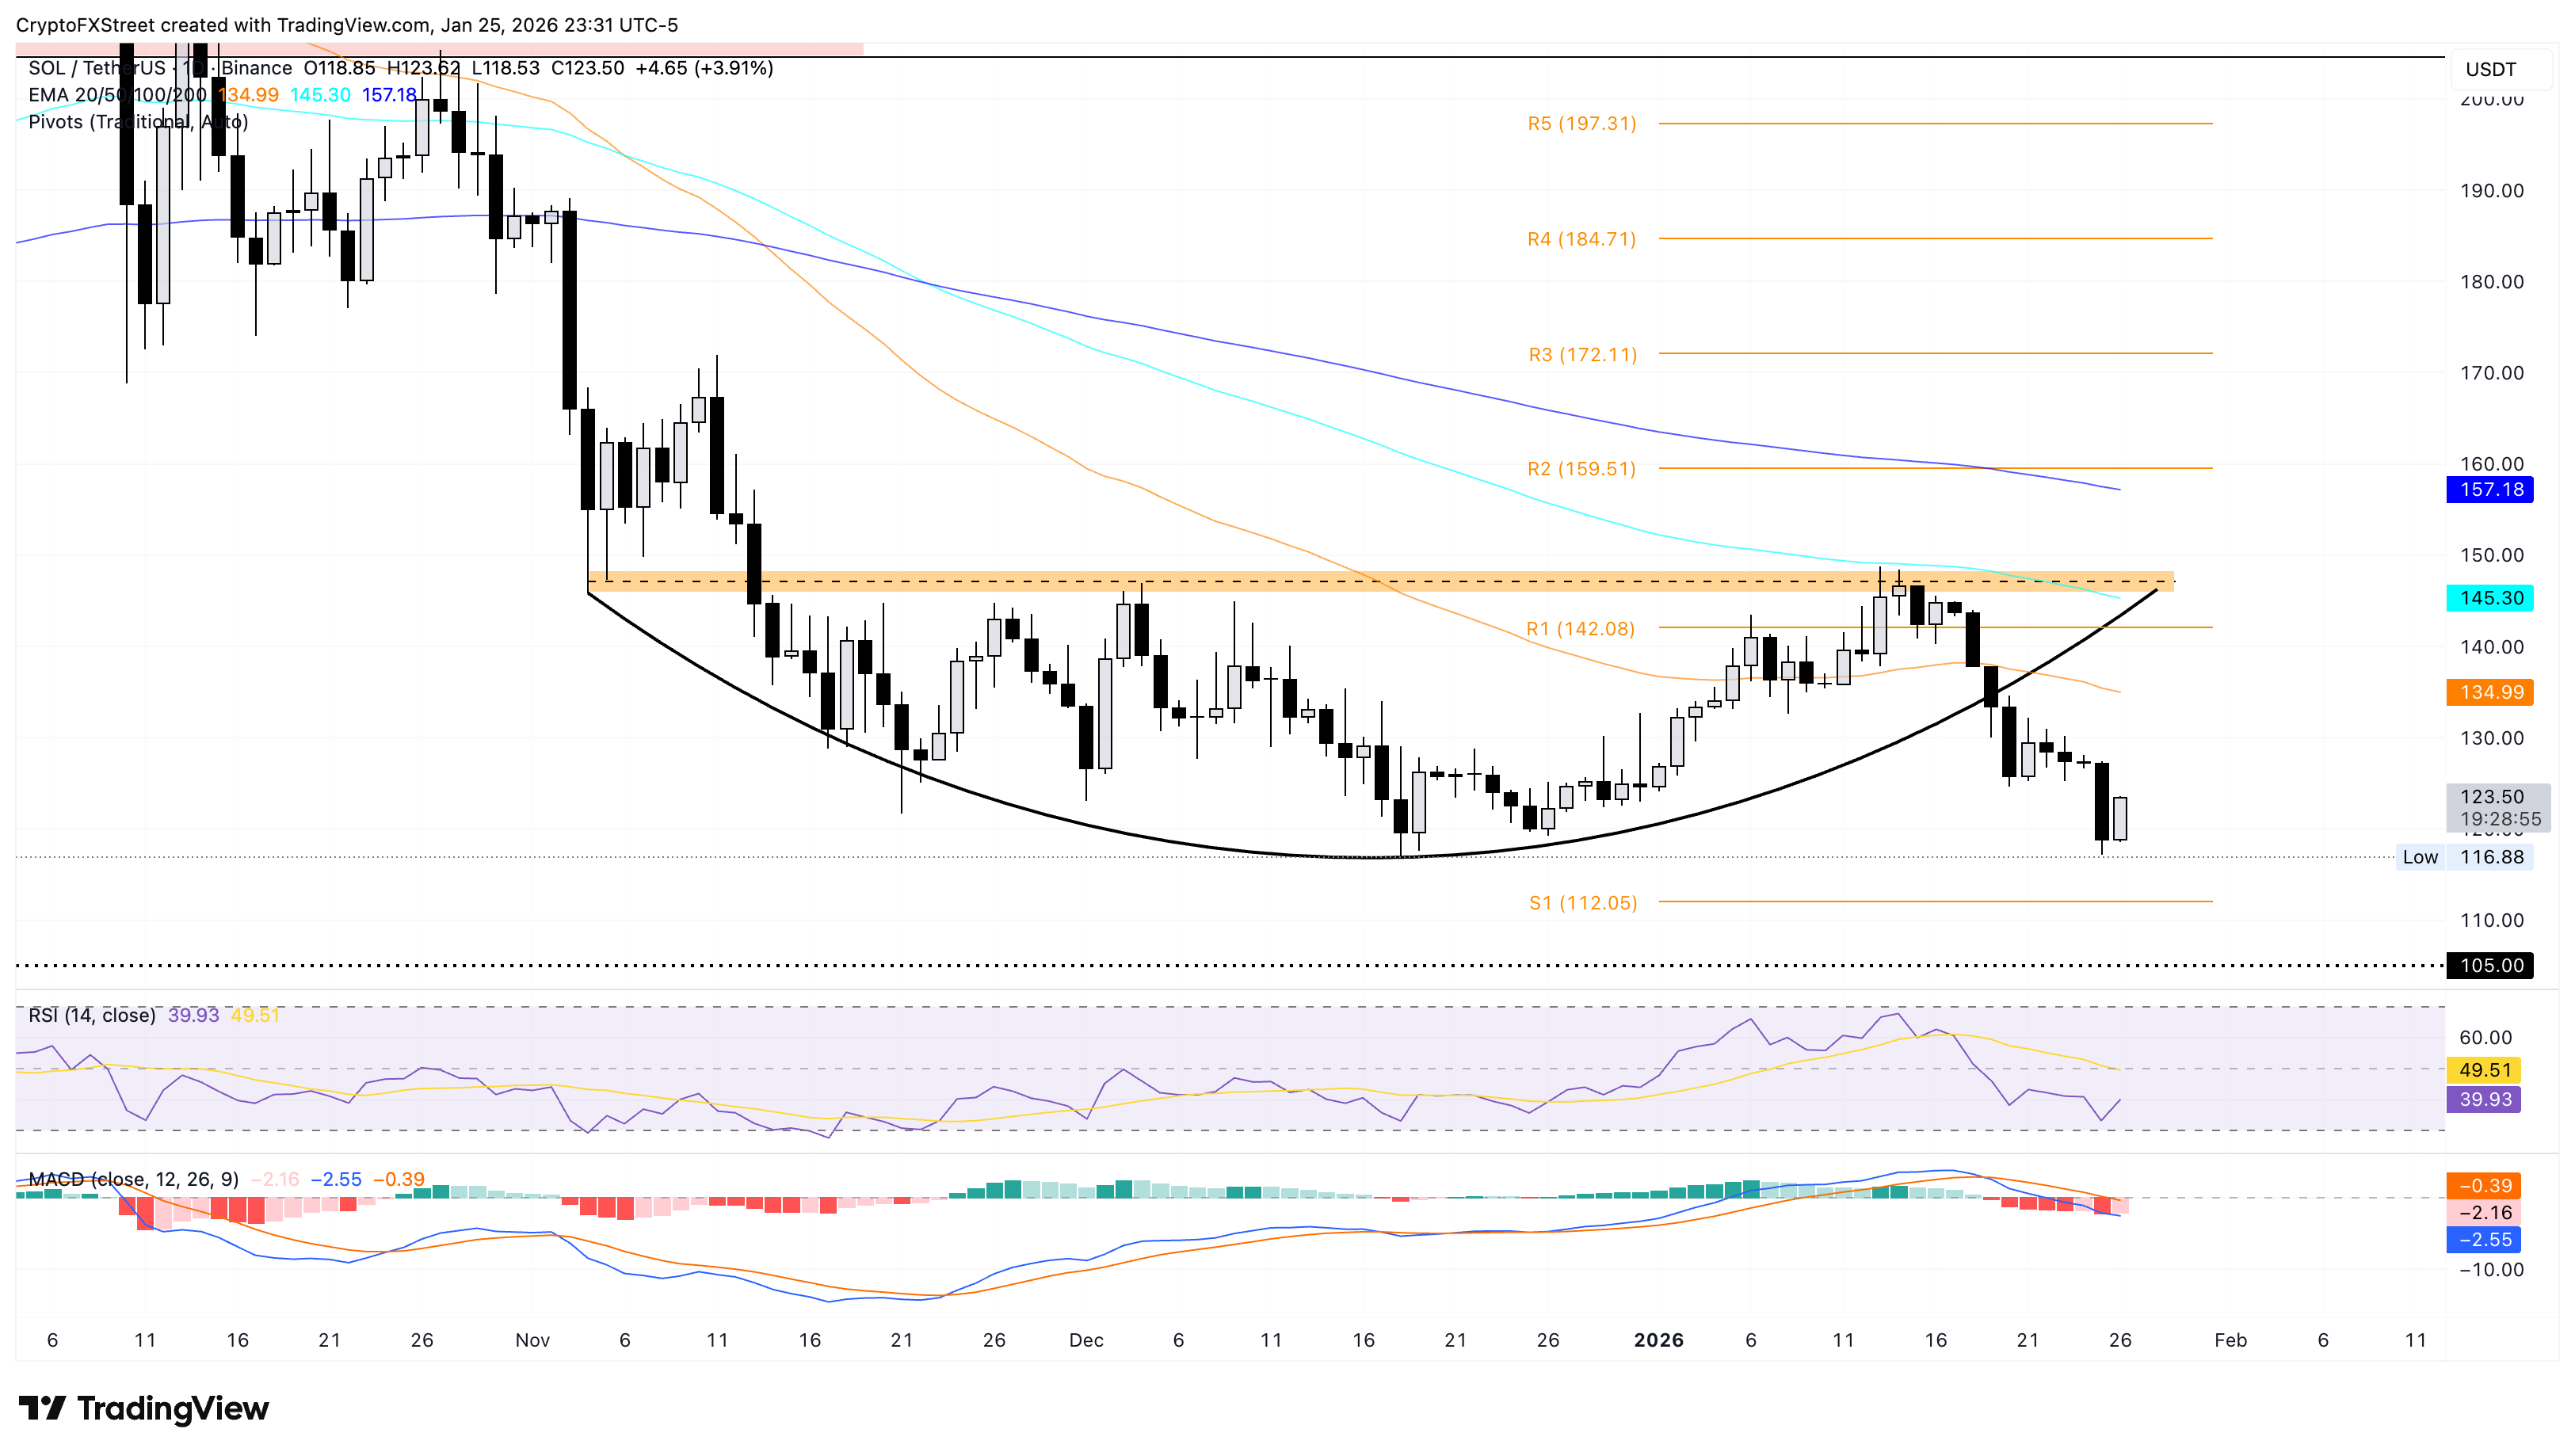
However, the downside risk persists if SOL drops below the December 18 low at $117, which would open the door to the S1 Pivot Point at $112, followed by a deeper zone at the $100 psychological support level.
(The technical analysis of this story was written with the help of an AI tool.)
Author

Vishal Dixit
FXStreet
Vishal Dixit holds a B.Sc. in Chemistry from Wilson College but found his true calling in the world of crypto.



