SOL price shoots past $30 while Solana’s TVL slips below the $1 billion mark
- Solana price marches against all odds to recoup gains above $30.00 from support at $26.85.
- SOL’s DeFi TVL slumps to 919.14 million despite the crypto market relief rally this week
- Solana price must flip the 200-day SMA into support to dodge a potential trend correction.

Solana price is exchanging hands at $31.86 after piggybacking on a mid-week crypto market relief rally. As reported in this article, Binance Coin price tagged $290 on Wednesday while Ethereum price was trading at $1,553 on Thursday. With the market generally bullish, the competitive smart contracts token SOL has the potential to obliterate resistance at $32.30 as bulls push to $39.00.
Solana TVL slides below $1 billion
Solana has recently become a force to be reckoned with in DeFi (decentralized finance) thanks to its fast blockchain and low transaction fees. The platform’s TVL (Total Value Locked) is an aggregate of all the tokens deposited in various functions of a DeFi protocol like Solana – encompassing staking, lending and liquidity pools.
The 2022 bear market has been tough on the DeFi sector, with TVL dropping across all platforms. Solana’s TLV has sustained a downtrend from its all-time peak of $10.08 billion in early November 2021. According to DefiLlama, the platform’s TLV now holds at $919 million after losing the $1 billion mark.
Platforms with a negative TLV growth need to catch up on liquidity, usability and popularity. These are, to a large extent, the building blocks of a successful crypto project. Therefore, with Solana’s TVL persistently declining, liquidity is bound to shrink alongside lower yields.
-638024772154990135.png)
Solana TVL – DefiLlama
Solana price sets eyes on $39.00
Solana is taking a breather between two critical levels – its immediate support at 38.2% Fibonacci level ($30.96) and a confluence resistance at $32.20. This key confluence level has been reinforced by the 200-day SMA (Simple Moving Average) (purple) and the 50% Fibonacci retracement level.
Since the OBV (On Balance Volume) indicator and the MACD (Moving Average Convergence Divergence) exhibit a positive outlook, Solana price could eventually move past the seller congestion highlighted at $32.30.
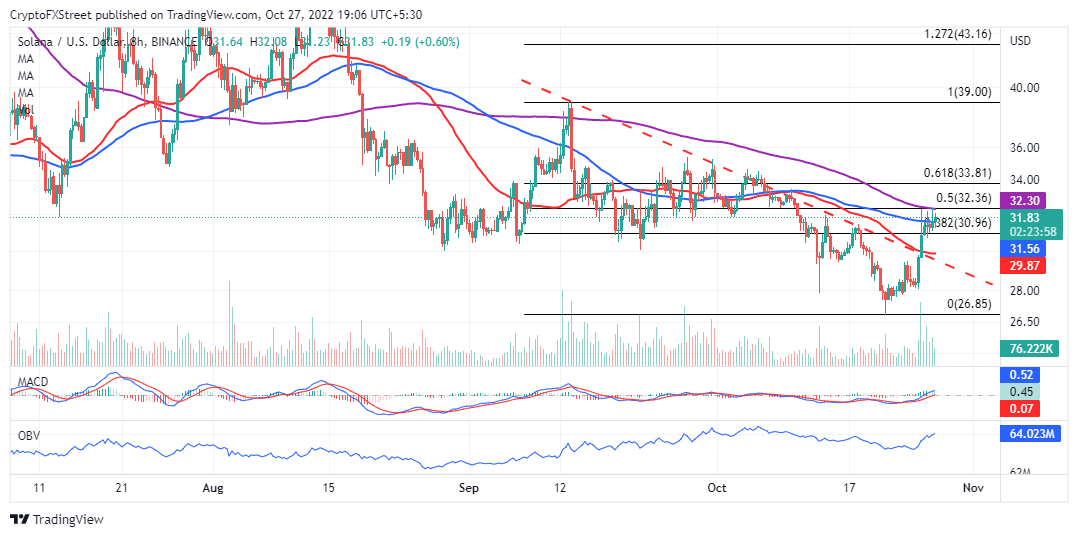
SOL/USD eight-hour chart
Traders who missed the move from support at $26.85 can look for new entries above the 200-day SMA for a conservative take-profit target at the 61.8% Fibonacci ($33.80). Stubbornly bullish traders can wait for Solana price to make a 100% bullish trend correction to $39.00.
On the other hand, a retracement below SOL’s immediate support at $30.96 should not be ruled out, especially if bulls fail to push past resistance at the 200 SMA. Short positions may be entered slightly below the support mentioned above for a profit target at the 50 SMA (in red), marginally above a descending trend line from September 13.
Author

John Isige
FXStreet
John Isige is a seasoned cryptocurrency journalist and markets analyst committed to delivering high-quality, actionable insights tailored to traders, investors, and crypto enthusiasts. He enjoys deep dives into emerging Web3 tren


