Shiba Inu price eyes 5% drop amid bearish network activities
- Shiba Inu price has declined by 5% from April’s highs, with possibilities of an extended decline.
- SHIB could drop further to tag the $0.00001035 as overhead pressure increases.
- A decisive flip of the 200-day EMA resistance into support would invalidate the bearish thesis.

Shiba Inu price (SHIB) recorded a negative performance across March, a downtrend that delivered the meme coin to the tight grip of the Exponential Moving Averages (EMAs) where it is currently trapped. These price-tracking indicators represent accumulating overhead pressure that prevents the altcoin from advancing.
Based on on-chain metrics, the abysmal growth for Shiba Inu price comes amid scarce whale transactions and slowing network growth, which could lead SHIB lower before identifying a dependable support level.
Shiba Inu price could drop another 5% to $0.00001035
Shiba Inu price dropped almost 15% across March and 5% from monthly highs. The trajectory shows that the widely advertised token burn has not done much for the meme coin as investors remain uncertain about the deflationary effect of the burn on SHIB’s price action. As a result, the second-largest meme coin by market cap continues to flash red with a seesaw price trajectory indicating high volatility.
If selling pressure increases, presumably because of traders moving to better-performing altcoins, Shiba Inu price could drop 5% from the current price of $0.00001093 towards the critical support at $0.00001035.
This is possible considering the growing overhead pressure due to the resistance confluence between the 100- and 50-day EMAs around $0.00001109 and more due to the 200-day EMA at $0.00001141. Notably, these levels have prevented Shiba Inu price from recording further gains since early March.
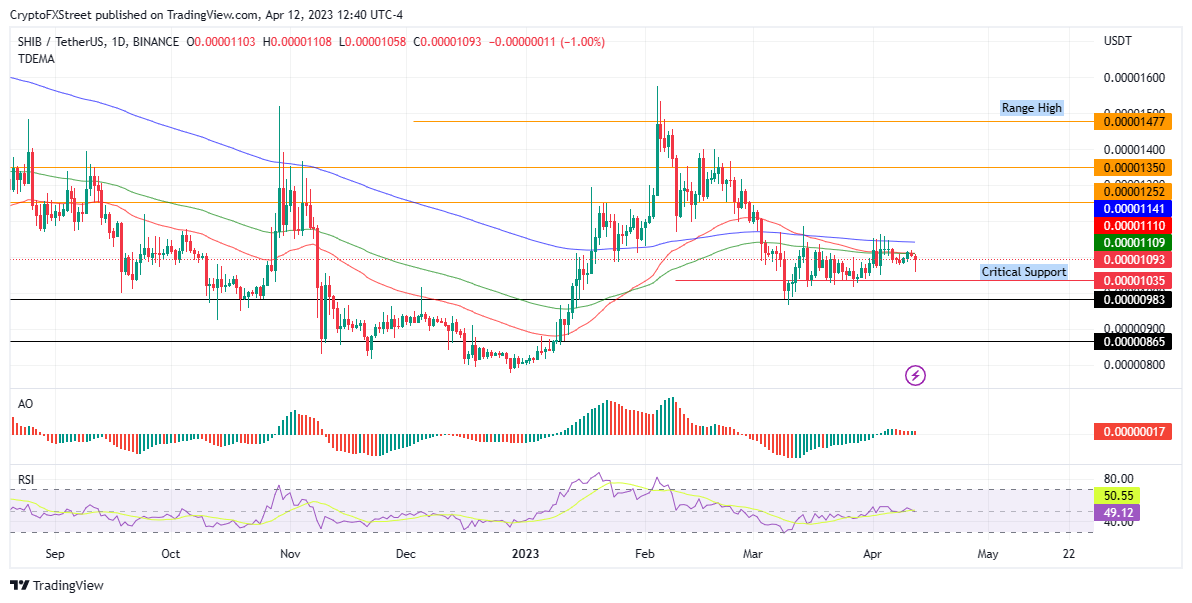
SHIB/USDT 1-day chart
Shiba Inu whales caving in, on-chain metrics show
Based on data from IntoTheBlock, Shiba Inu whales have reduced their trading activity by a significant margin over the past few weeks.
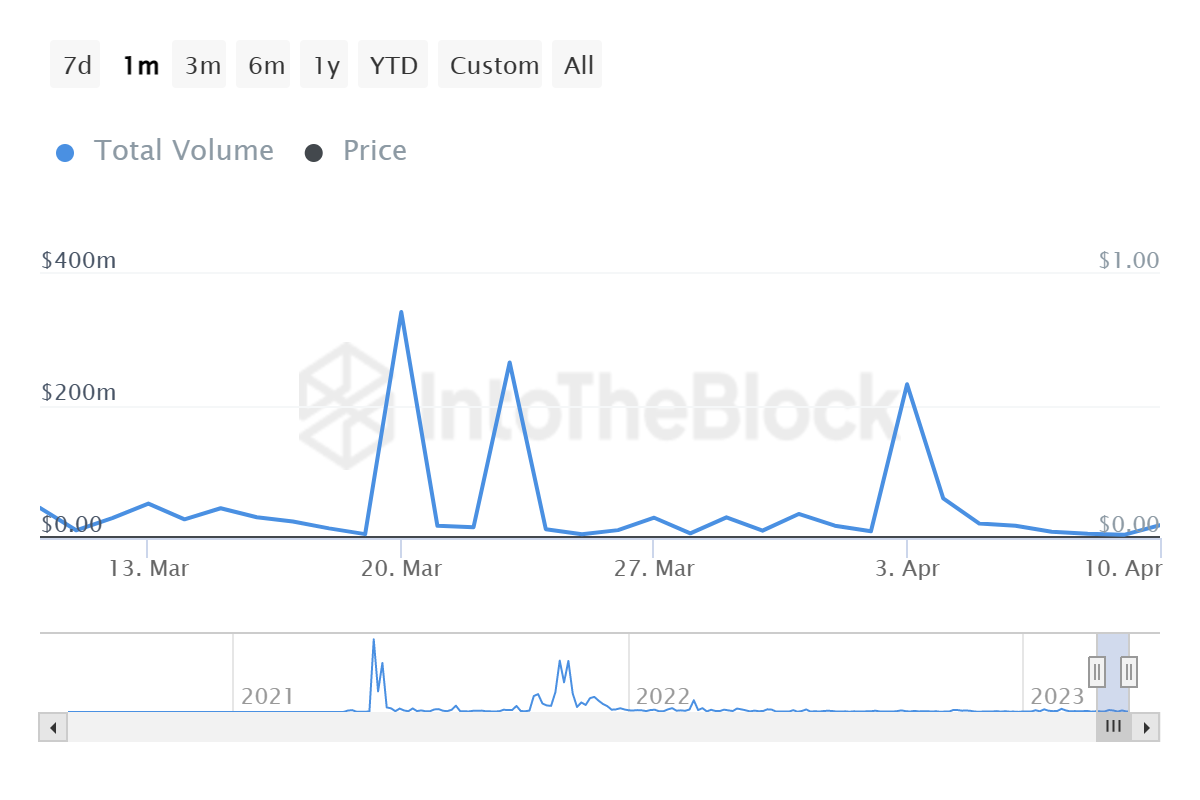
The volume of large transactions for Shiba Inu has declined by around 90% since April 3, dropping from 232.9 million to a meager 19.39 million transactions as of April 10. The large transactions metric tracks the daily volume of trades worth $100,000 and above on a blockchain network. A consistent drop could suggest that large investors are losing confidence in the short-term prospects of Shiba Inu price.
Further, the downtrend in SHIB acquisition by new users also supports the bearish thesis for Shiba Inu price and is a concerning thing to note for investors.
 [20.50.13, 12 Apr, 2023]-638169221254101453.png)
Based on Santiment data, SHIB has experienced a massive drop in wallet addresses created since the recent range high, dropping from 4,500 to around 1,500 between February 4 and April 12. Similarly, network growth, which represents the total number of new wallet addresses created daily, has reduced. This indicates that the meme coin is losing its share of the market as well as traction, further adding credence to the bearish thesis for Shiba Inu price.
Still, SHIB could get some relief if sidelined investors jump in. Shiba Inu price could correct, taking a northbound move that could see the altcoin breach the supplier congestion zones due to the 100-, 50-, and 200-day EMAs at $0.00001109, $0.00001110, and $0.00001141, respectively. Recovery of the latter would invalidate the bearish scenario.
In highly bullish cases, Shiba Inu price could reclaim the late February highs around $0.00001252.
Author

Lockridge Okoth
FXStreet
Lockridge is a believer in the transformative power of crypto and the blockchain industry.



