Shiba Inu continues to present a buying opportunity before SHIBA gains over 100%
- Shiba Inu price action is unchanged on its Point and Figure chart.
- A tight trading range over the past few weeks could be a sign of strength.
- Downside risks exist but are very limited in scope and range.

Shiba Inu price has been stuck in a very, very constricted trading range over the past seven trading days, but throughout December, SHIBA formed a strong support zone and a new Volume Point Of Control – indicating a new uptrend may be imminent.
Shiba Inu price readies for launch and significant outperformance
Shiba Inu price, from an Ichimoku perspective, looks extremely bearish and should be pursuing new multiple-month lows – but it isn’t. Short-sellers have been unable or unwilling to push Shiba Inu into a central capitulation zone. Instead, participants have created a new and massive Volume Point Of Control at $0.000032.
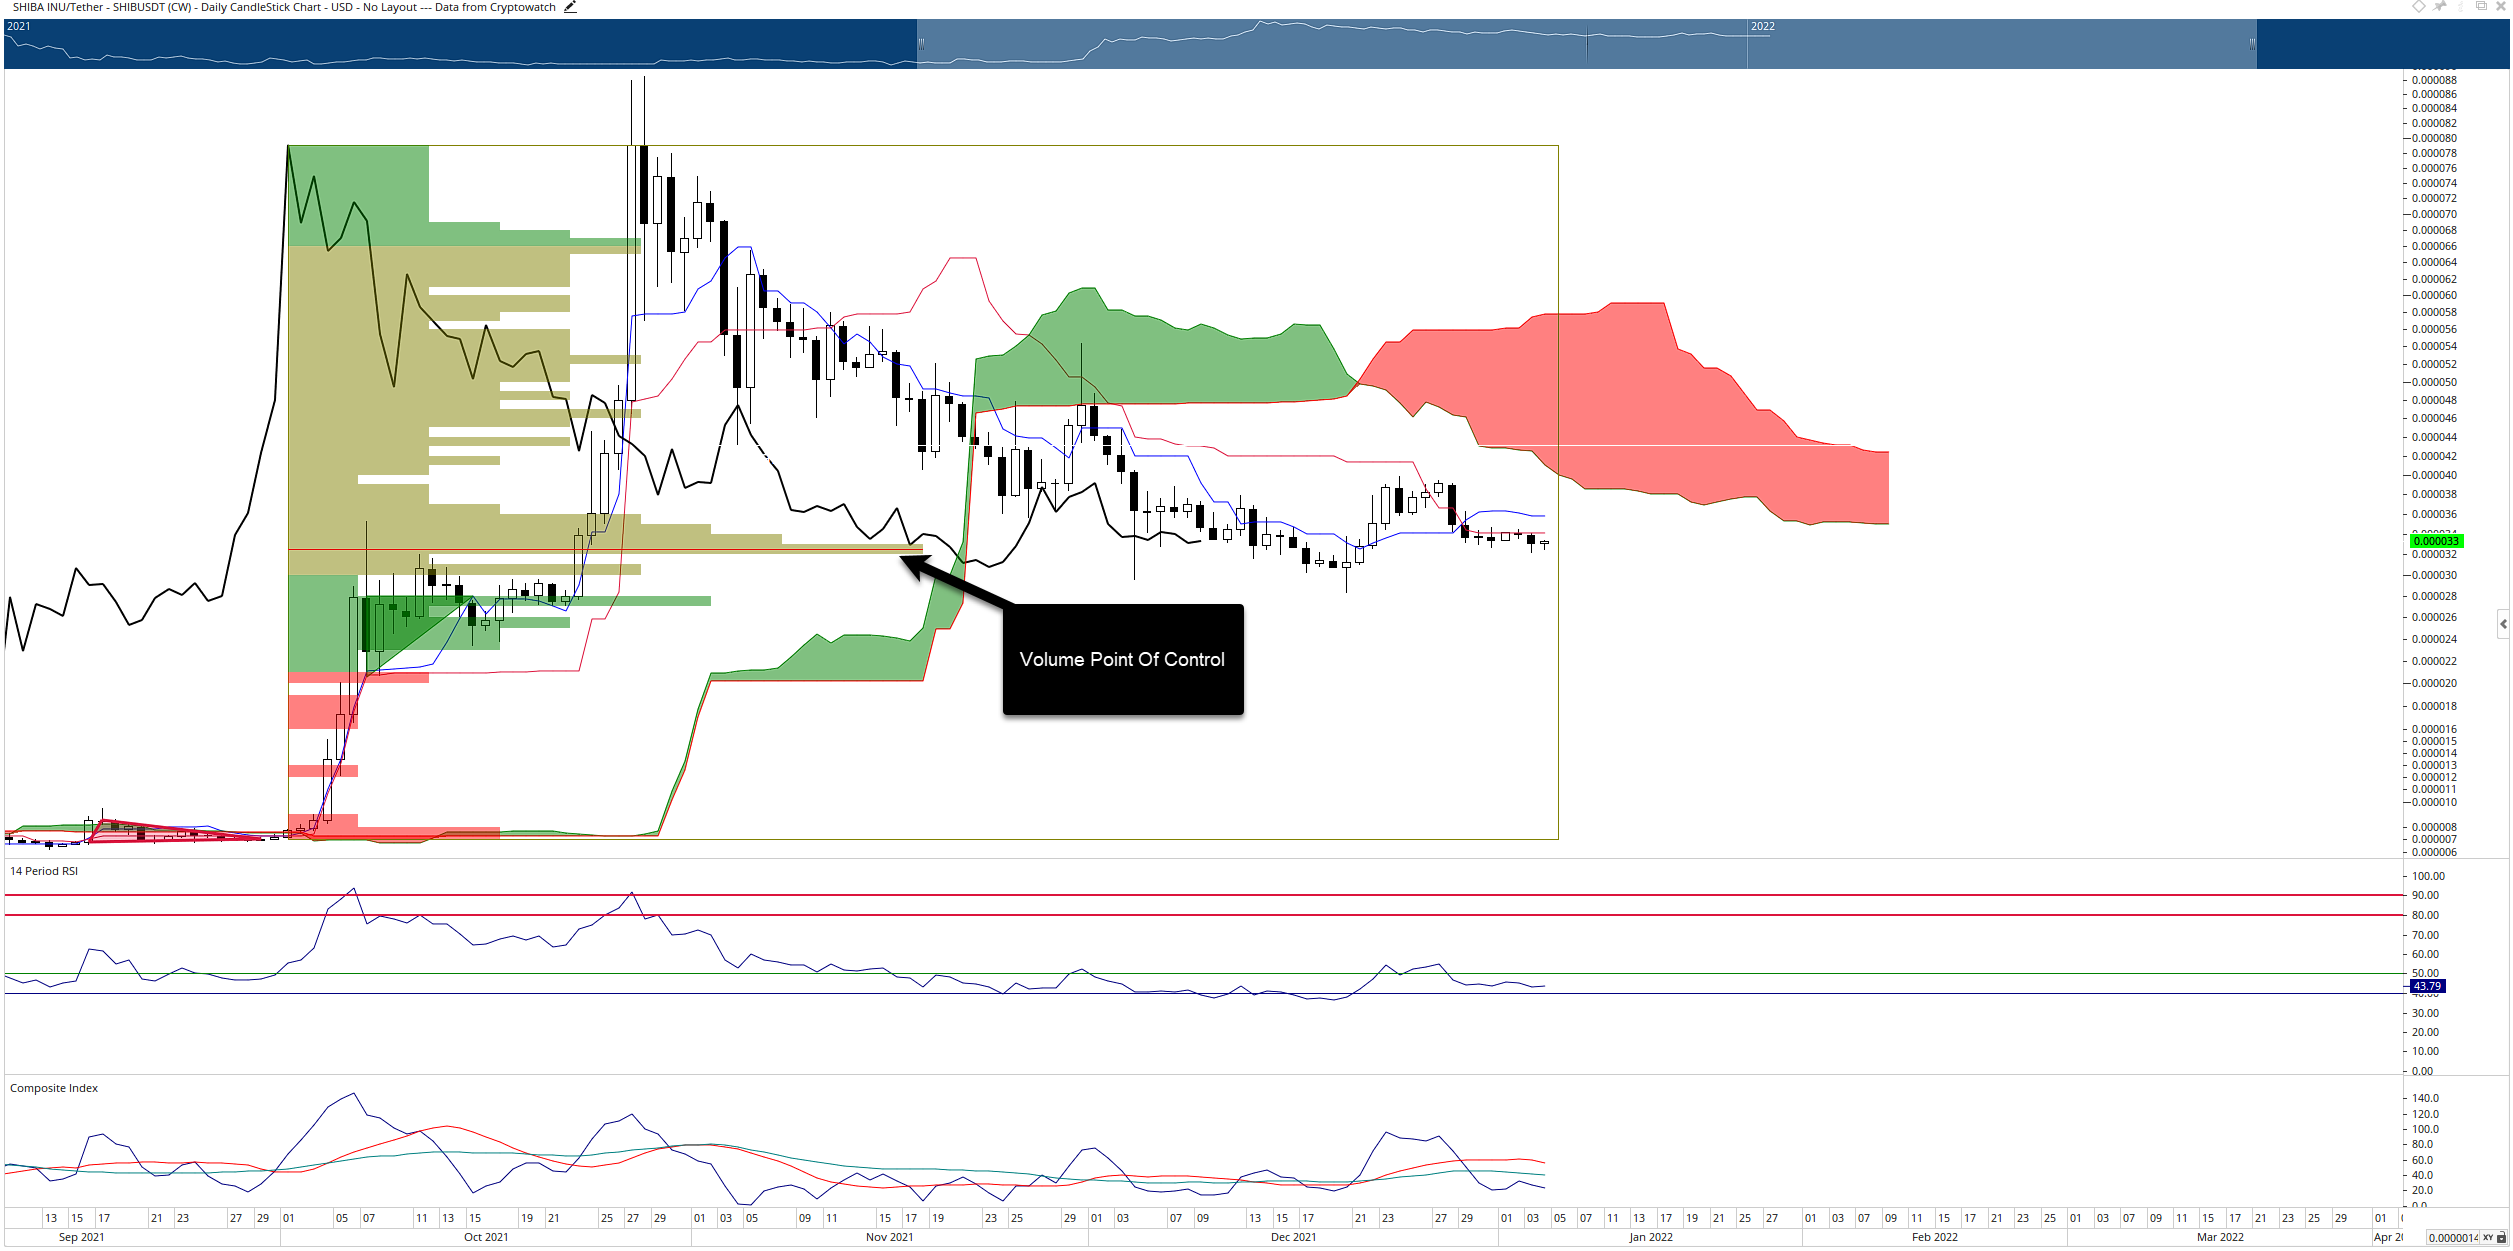
SHIBA/USDT Daily Ichimoku Chart
The Volume Point Of Control in the volume profile is an equilibrium area. It is the price level where the most buying and selling has occurred. It is where bulls and bears have battled the most. It is a tipping point level and whichever direction Shiba Inu price eventually moves, those on the opposite side of the trade will get crushed.
On the $0.0000025/3-box reversal Point and Figure Chart, SHIBA is unchanged from the recent, prior analysis. The theoretical long entry remains a buy stop order at $0.0000375, a stop loss at $0.0000275, and a profit target at $0.0000775. The trade idea represents a 4:1 reward for the risk setup with an implied profit target of nearly 107% from the entry.
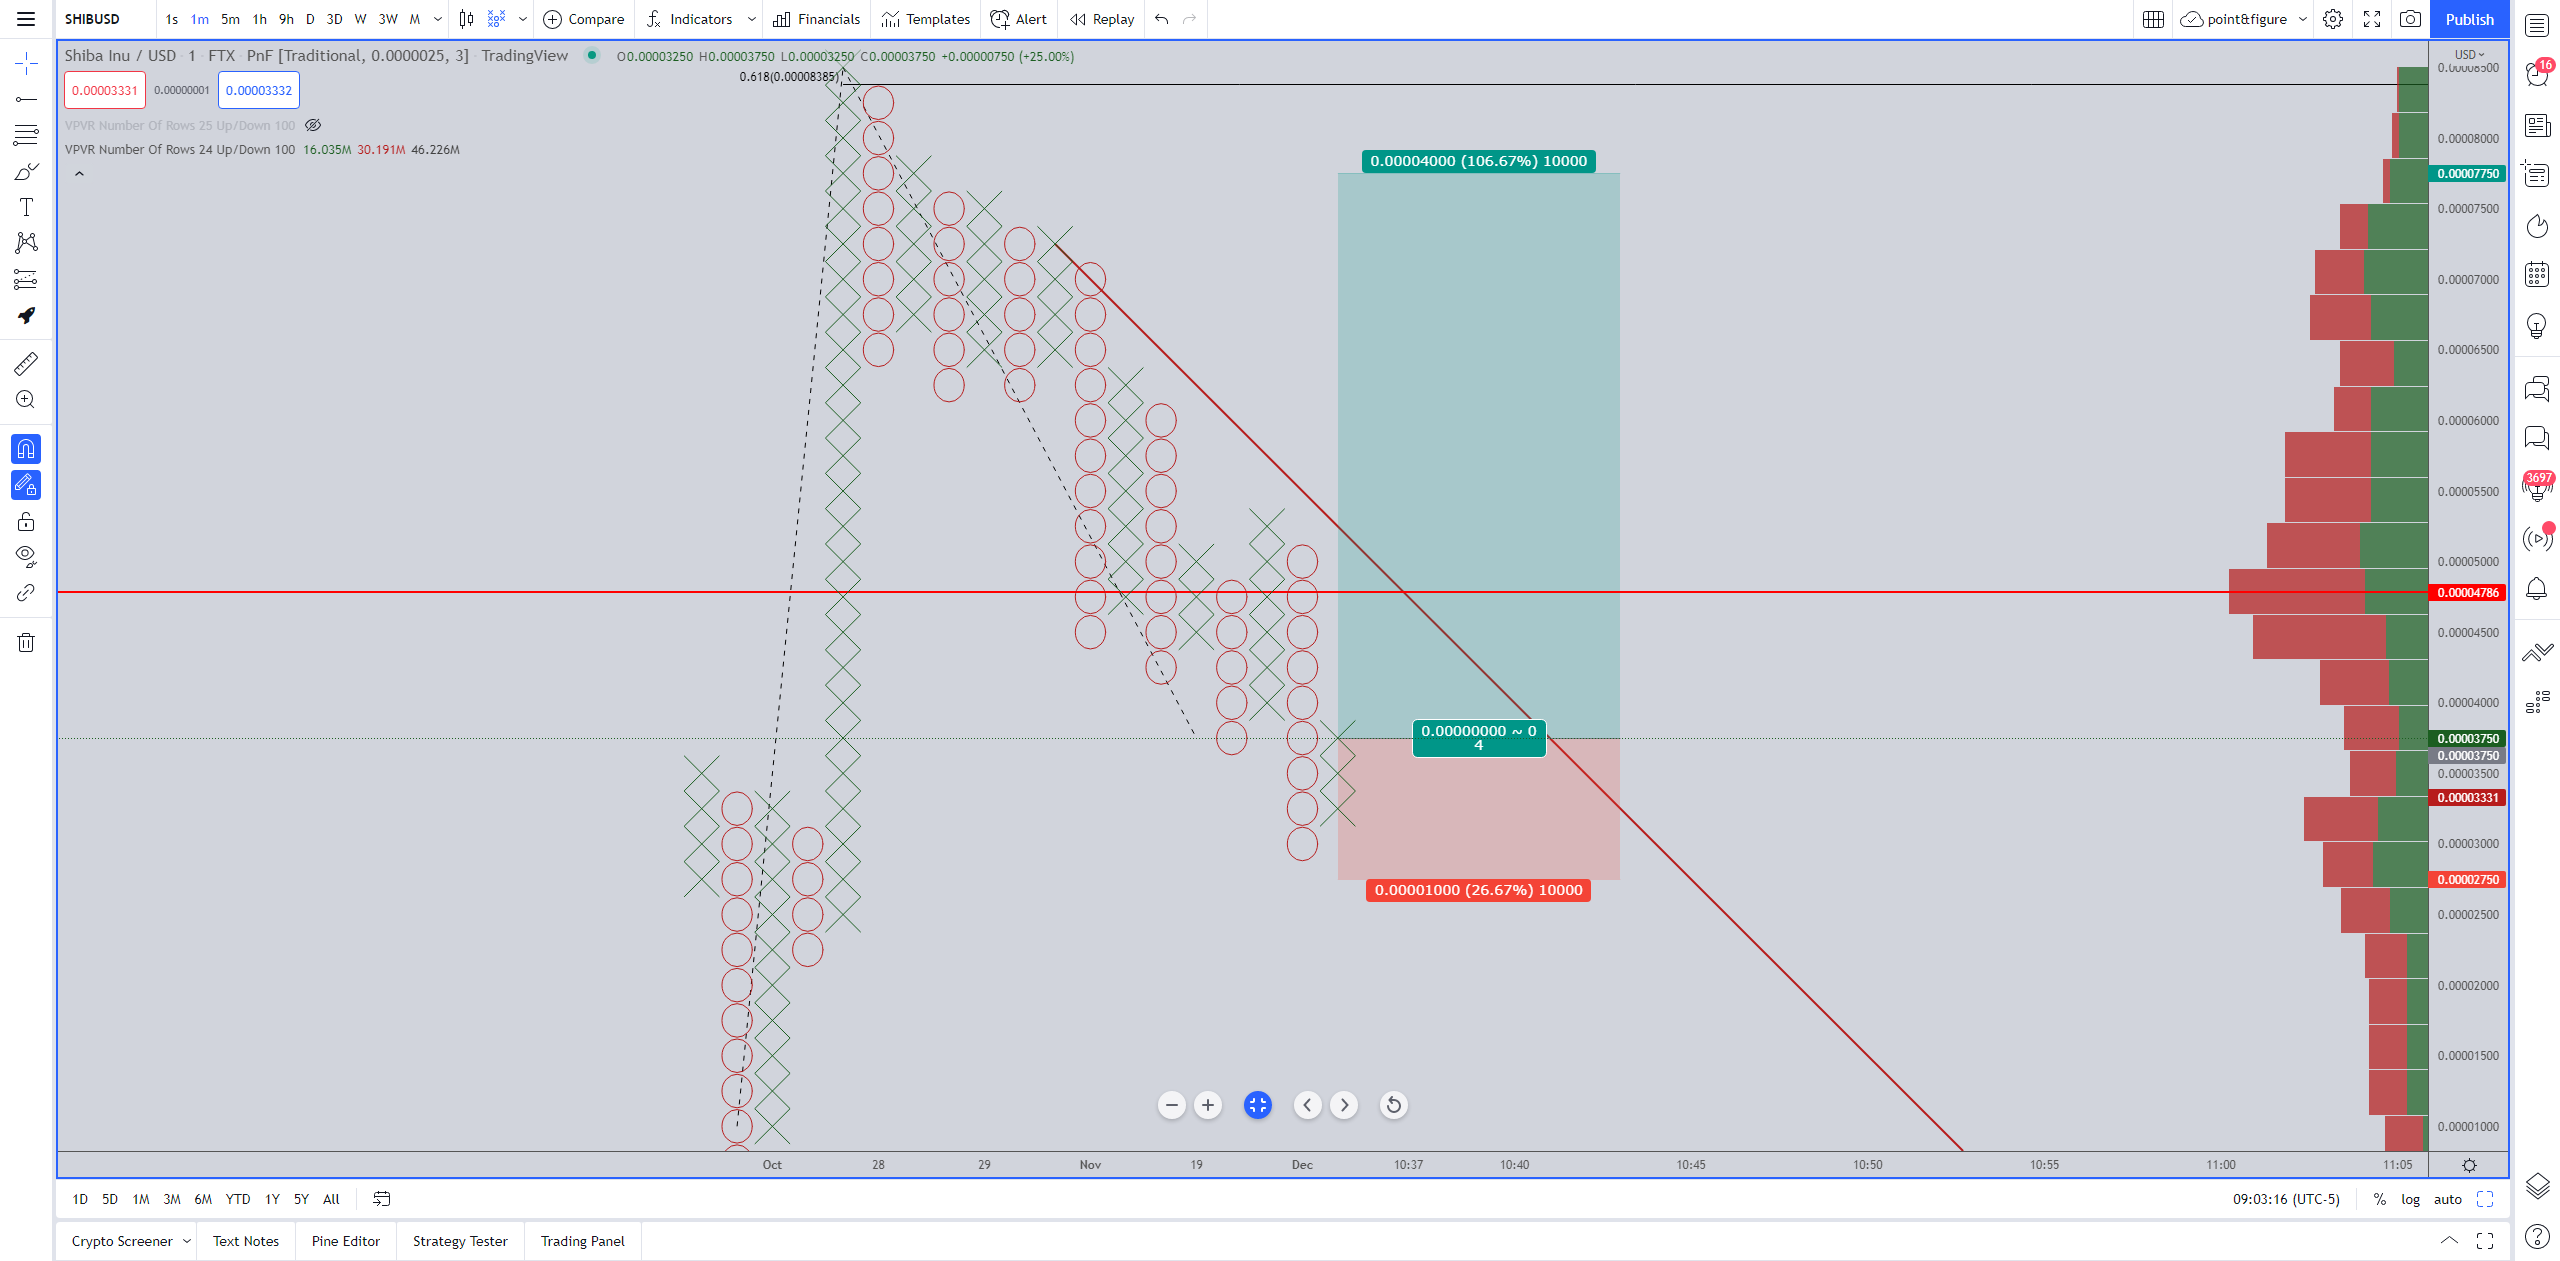
SHIBA/USDT $0.0000025/3-box Reversal Point and Figure Chart
The long trade idea is invalidated if Shiba Inu price drops below $0.0000200. Additional downside risks below $0.0000200, however, are probably limited to $0.0000150.
Author

Jonathan Morgan
Independent Analyst
Jonathan has been working as an Independent future, forex, and cryptocurrency trader and analyst for 8 years. He also has been writing for the past 5 years.