SafeMoon price reveals SAFEMOON may be on the cusp of a 90% rally
- SafeMoon price chart illustrates an inverse head-and-shoulders pattern.
- SAFEMOON volume profile underlying the pattern is not textbook.
- Two-hour Relative Strength Index (RSI) does not show an overbought reading, giving room for a breakout to develop.

SafeMoon price declined close to 80% from May 12 to the May 19 low, highlighted by an intra-day decline of 70% on May 19 provoked by Chinese regulatory announcements. SAFEMOON has stabilized on the intra-day charts and just triggered an inverse head-and-shoulders pattern with the promise of a noteworthy rally if the decentralized finance token can generate upside price traction.
SafeMoon price volatility leaves investors gasping for air
For the unaware, SAFEMOON is a new cryptocurrency that began trading in March 2021. The digital token began trading at $0.000000001 and has a tiny market capitalization. SAFEMOON has a maximum supply of 10 quadrillion tokens but only has 600 billion in circulation.
Based on the data provided by Bitsmart going back to April 5, SafeMoon price has been a roller-coaster for the brave investor. The period has seen gains of 2900% and 700%, and losses in the range of 80-90%.
On the two-hour chart, SafeMoon price formed an inverse head-and-shoulders pattern that triggered earlier today before SAFEMOON pulled back into the formation. The construction of the right shoulder has gravitated along the 50 two-hour simple moving average (SMA).
The bottoming pattern has a measured move target of $0.00001066, representing a 93% return from the neckline at breakout. The only two obstacles between SafeMoon price and the measured move target are the 200 two-hour SMA at $0.00000776 and the declining trend line from the May 12 high at $0.00000807.
The 61.8% and 78.6% Fibonacci retracement levels at $0.00000841 and $0.00000999, respectively, may offer minor resistance before SafeMoon price reaches the measured move target of $0.00001066.
The bullish outlook will remain active unless SafeMoon price closes below the right shoulder at $0.00000453.
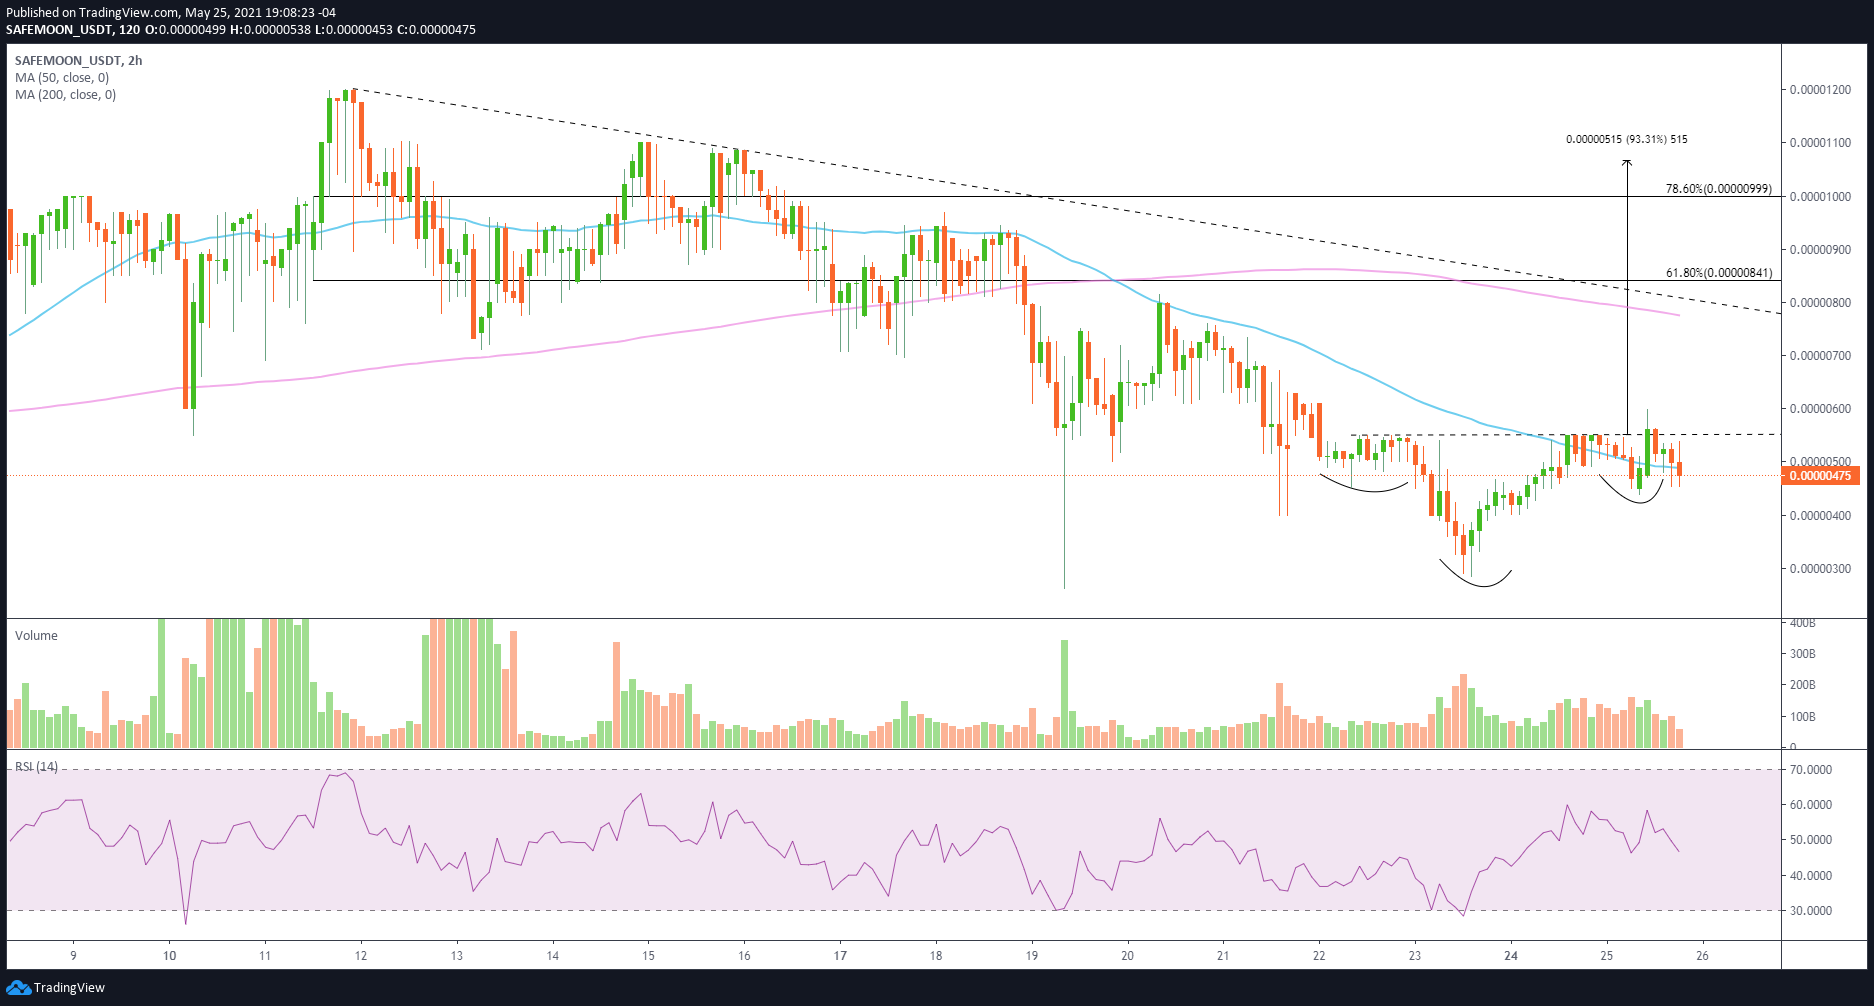
SAFEMOON/USD 2-hour chart
If SafeMoon price does close below the right shoulder on the two-hour chart, there is no formidable support until $0.00000285 and then $0.00000261. Any further selling would leave SAFEMOON exposed to test $0.00000150.
Author

Sheldon McIntyre, CMT
Independent Analyst
Sheldon has 24 years of investment experience holding various positions in companies based in the United States and Chile. His core competencies include BRIC and G-10 equity markets, swing and position trading and technical analysis.


