|

SafeMoon price stuck in a downward channel toward $0.00000050

  • SafeMoon price is caught in a consolidation squeeze around $0.00000185.
  • A break lower is announced with a squeeze from sellers against a short-term trend line.
  • A test of the lower band in the trend channel is the only support for SafeMoon before touching $0.00000050.

SafeMoon (SAFEMOON) has been caught in a downward trend channel since May and has not been able to break out of it since. Sellers look to have the upper hand as every attempt to break the upside is met with heavy selling force. An intermediary consolidation looks to send SAFEMOON price action down again. 

SafeMoon price trend channel looks to dictate law in its price action to the downside

SafeMoon price action has been getting squeezed from both sides for a few days. There is a short-term descending red trend line from above, and from the upside the green ascending trend line is going the same for buyers. Prices are getting squeezed in from both sides. It does not look too good for buyers as the price is pressed toward the downside. The additional factor in that drive is that the 5-day, 10-day and 30-day Simple Moving Average (SMA) limits any upside. Granted, there was a break upwards on September 13, but that was short-lived, and SAFEMOON retreated quickly back below the 30-day SMA.
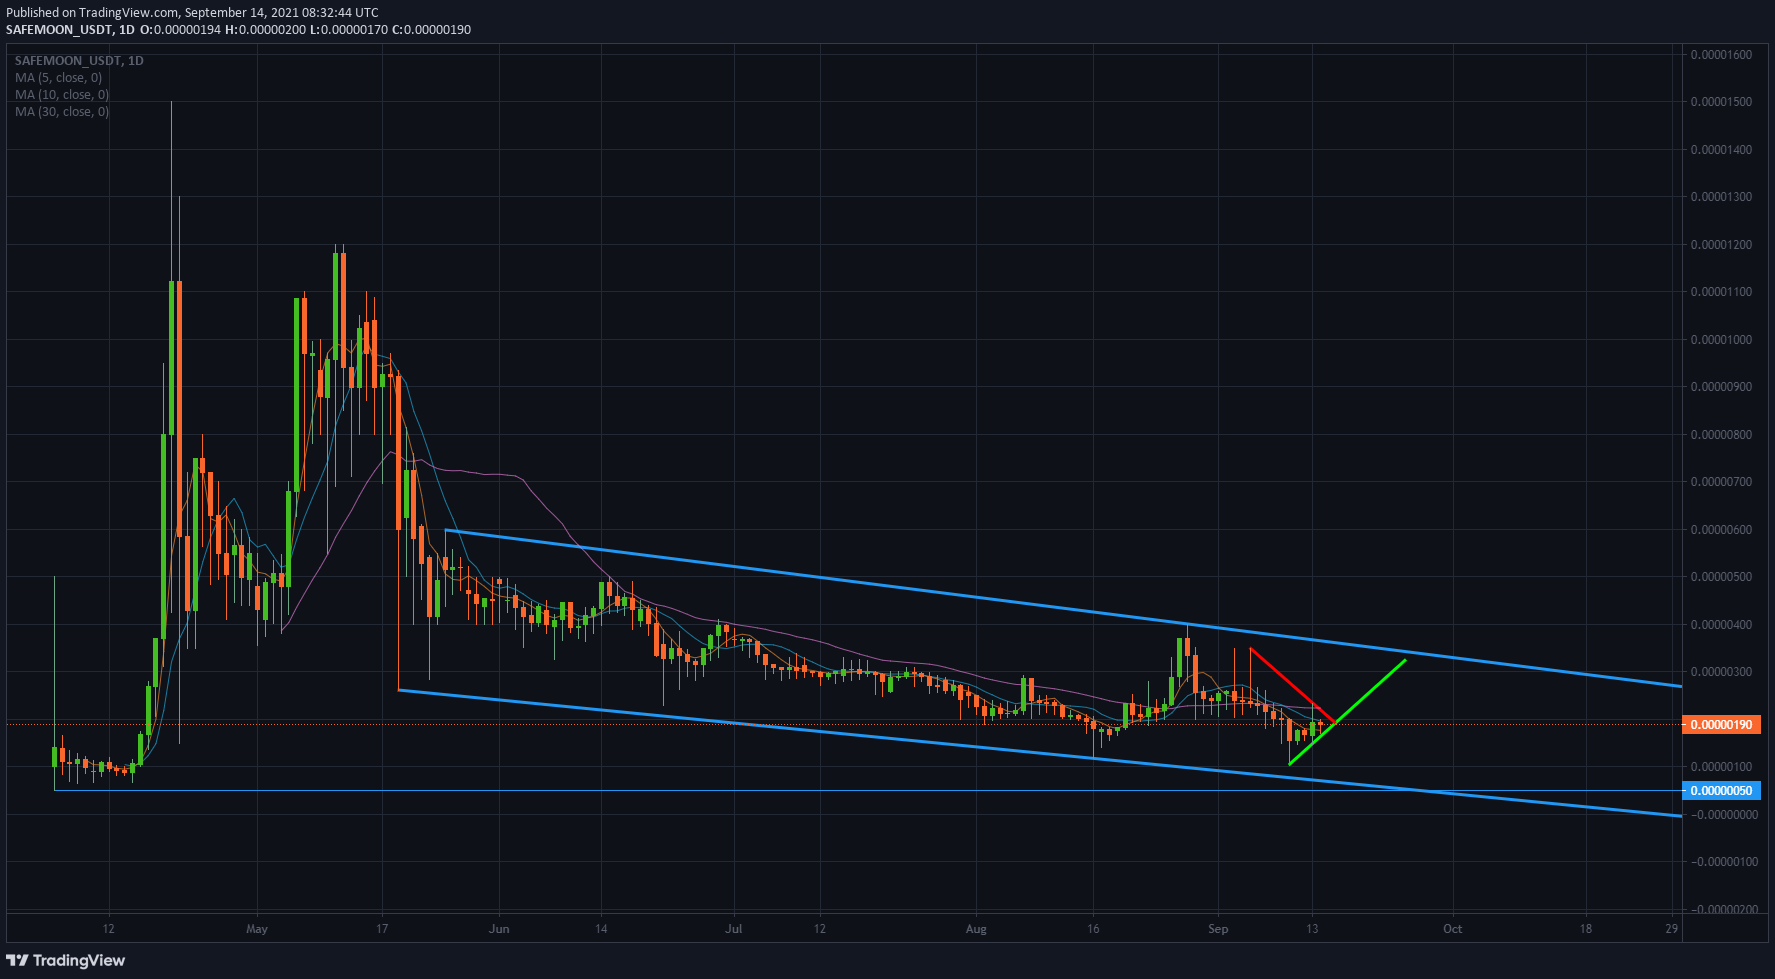
SAFEMOON/USD daily chart

SAFEMOON/USD daily chart

SAFEMOON looks ready for the break lower today or tomorrow. From there on, it will look for support from the low end of the downward trend channel. If sellers can push price action even below the trend channel, expect $0.00000050 as the ultimate low to be tested, as this is the lowest price ever in SafeMoon.

Should SafeMoon price action fall in favor of the buyers, expect another attempt to break above the 30-day SMA and test the upper band in the descending trend channel. Expect that to be around $0.00000300.

Author

Filip Lagaart

Filip Lagaart is a former sales/trader with over 15 years of financial markets expertise under its belt.

More from Filip Lagaart
Share:

Editor's Picks

XRP Price Forecast: XRP trades sideways as Ripple targets 10 million agentic AI transactions
Ripple (XRP) is losing momentum on Thursday, albeit gradually, trading above $1.13. The remittance token tagged a weekly high of $1.16 on Tuesday, with gains mainly attributed to developments on the United States (US) Clarity Act and recent signs that inflation is easing in the world’s largest economy.
Crypto Today: Bitcoin, Ethereum, XRP trim gains despite resilient ETF inflows
Cryptocurrency prices are trending lower on Thursday, pressured by renewed inflation concerns stemming from ongoing tensions between the United States (US) and Iran and persistently elevated Oil prices. Bitcoin (BTC) is approaching short-term support at $65,000, with upside resistance remaining firm at $67,000.
Worldcoin Price Forecast: WLD steadies as multiple bullish signals line up
Woldcoin (WLD) price trades around $0.3838 at press time on Thursday, extending a consolidative tone capped beneath the 50-day Exponential Moving Average (EMA) at $0.4141. WLD token emissions are scheduled to drop by 43% from Friday, reducing supply pressure. Retail activity in WLD derivatives remains firm, with a 40% rise in trading volume and elevated funding rates.
Dogecoin Price Forecast: DOGE nears yearly low as risk appetite fades
Dogecoin (DOGE) extends its decline on Thursday, approaching its yearly low at $0.069 as bearish sentiment continues to weigh on the meme coin. Escalating US-Iran conflict and fresh Houthi threats have dampened risk appetite, weighing on speculative assets such as DOGE. Weakening derivatives metrics and a deteriorating technical outlook suggest a deeper correction if DOGE slips below $0.069.
Bitcoin’s potential recovery in the second half hinges on these 4 catalysts
Bitcoin (BTC) has fallen over 34% in the first half of this year as the King Crypto failed to capitalize on a good semester for risk assets despite the woes from the Iran war.


