RNDR Price Forecast: Do-or-die for bulls as Render Token confronts a critical hurdle
- Render Token price is at an inflection point as the $2.5 hurdle comes into play for the 12th time in a month.
- RNDR could breach this hurdle for 25% gains or repel it for 30% losses, depending on how bulls play their hand.
- While indicators favor bulls, investors should not disregard the magnetic pull of the insufficiency represented in the FVG.

Render Token (RNDR) price is at an inflection point as the token faces a rather formidable barrier. Several attempts to break above this hurdle have either failed or proven premature as the price pulled back almost immediately. As such, the next move for the GPU-computing token depends on how bulls play their hand going forward with or without the influence of Bitcoin (BTC).
Also Read: Top 3 Price Prediction Bitcoin, Ethereum, Ripple: BTC set to punish greedy bulls
RNDR price is at crossroads
Render Token (RNDR) price action has shown stark volatility since early February after a 450% climb between January and February 7. Between April 26 and May 22, Render Token price made almost 12 goes at this barricade but was rejected every time, with three breakouts above the level proving premature as bulls lacked adequate momentum. For the intelligent reader, a decisive break might be a long green daily candlestick extending above the resistance high and itself closing near its high, solidifying the bullish stance.
Nevertheless, the odds favor the bulls, considering RNDR price had strong downward support due to buying pressure from the 50-, 100-, and 200-day Exponential Moving Averages (EMA) at $1.9, $1.6, and $1.4, respectively.
Therefore, an increase in buyer momentum could fuel a break above the $2.5 resistance level, paving the way for a 25% extension from the current price to the $3.0 target.
The Relative Strength Index (RSI) position at 62 and above the mean line also adds credence to the bullish thesis, suggesting bulls are ahead and that there is still more room north before Render Token becomes overbought.
Further, the Awesome Oscillators (AO) are also in the positive region with a strong inclination towards bullishness as the green bars push further above the midline.
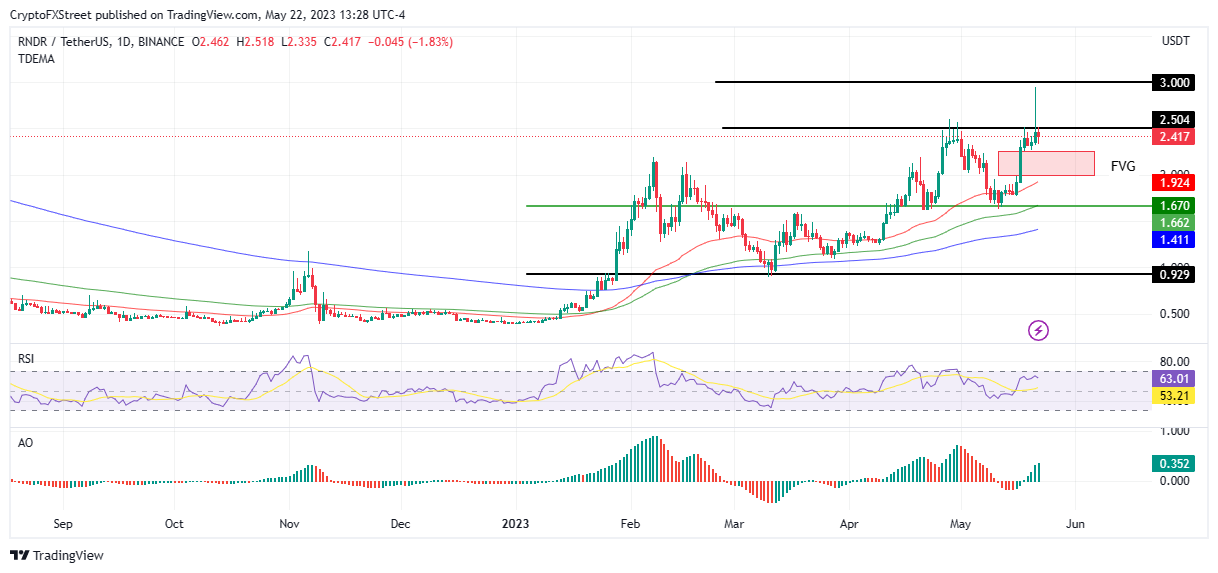
RNDR/USDT 1-Day Chart
Conversely, if buyer momentum wanes or traders begin early profit-taking, the Render Token price could repel the $2.5 barricade. This repulsion could be reinvigorated by the magnetic pull of the Fair Value Gap (FVG) shown in red.
Fair Value Gaps are created within a three-candle sequence and are commonly visualized on the chart as a large candle whose neighboring candles’ upper and lower wicks do not fully overlap the large candle. In this case, the May 16 and May 18 wicks fail to overlap the long candle on May 17. With this vacuum acting as a magnet, RNDR could drop 20% to tag the 50-day EMA at the $1.9 support level, thereby completing the inefficiency highlighted in pink.
In the dire case, RNDR price could complete a 30% descent, tagging the support confluence between the horizontal line and the 100-day EMA at $1.6. Failure of both these critical buyer congestion zones to hold could catalyze a selling spree toward the 200-day EMA at $1.4 or a drop-down to the $0.9 range low.
It should be noted that the RSI had just tipped downward, often interpreted as bulls leaving the market. This would favor the downside.
Author

Lockridge Okoth
FXStreet
Lockridge is a believer in the transformative power of crypto and the blockchain industry.




