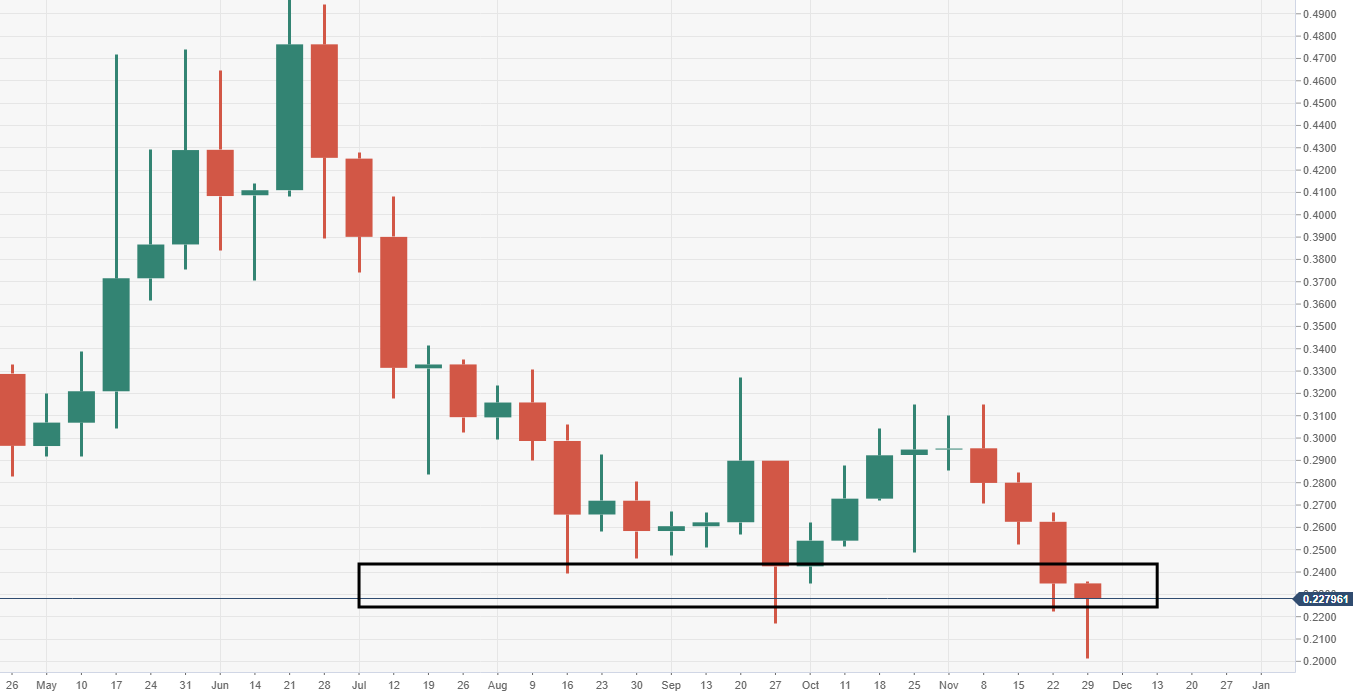
Ripple's XRP technical analysis: XRP/USD weekly candlestick forming a potential reversal hammer
- Ripple's XRP price is trading in the green by some 3.00% in the session on Friday.
- XRP/USD has a task of attempting smash through resistance ahead of the $0.2500 mark.
- The current candlestick via the weekly is pushing for a potential reversal hammer closure.

XRP/USD weekly chart
The bulls will be attempting to snap a four consecutive week of losses run, where the price has dropped from $0.3100 down to $0.2000.
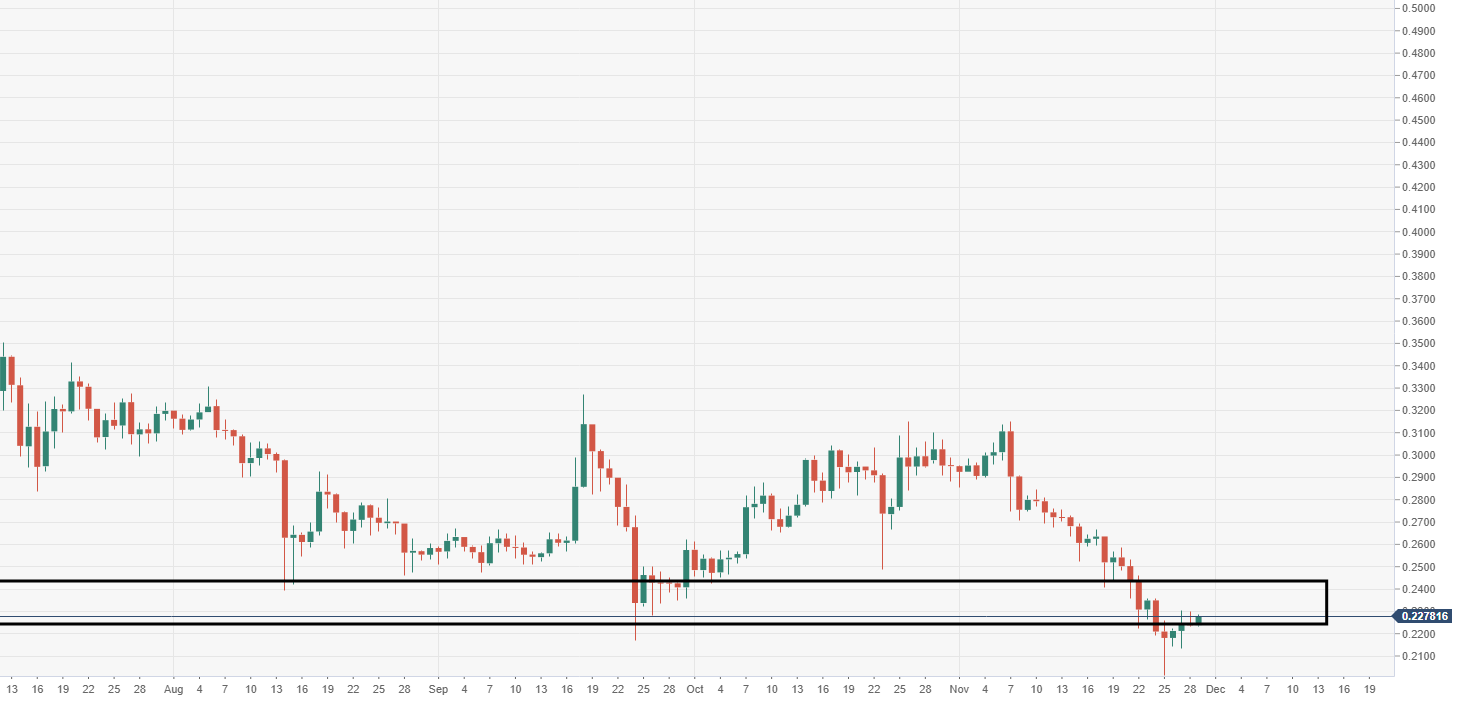
XRP/USD daily chart
Bulls are attempting to break down a heavy supply region seen running from $0.2300-0.2500.
Spot rate: 0.2305
Relative change: +3.00%
High: 0.2331
Low: 0.2232
Author

Ken Chigbo
Independent Analyst
Ken has over 8 years exposure to the financial markets. He started his career as an analyst, covering a variety of asset classes; forex, fixed income, commodities and equities.
More from Ken Chigbo


