Ripple's XRP Technical Analysis: XRP/USD make promising breakout of a bearish pattern
- Ripple's XRP price is trading in the red by some 1.90% in the session on Monday.
- XRP/USD price has demonstrated some signs of stabilization, as it runs with four consecutive sessions of gains.
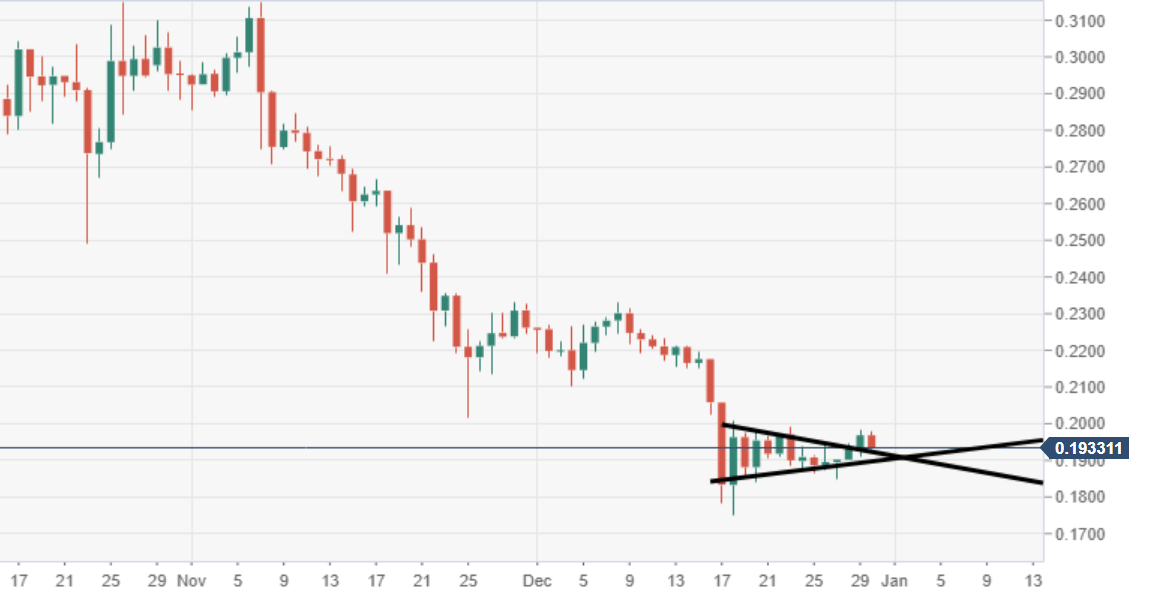
- There is a big barrier in the way of further upside seen at the psychological $0.2000 mark.

XRP/USD daily chart
Price action via the daily chart view is moving within a bearish pennant pattern, subject to a breakout south.
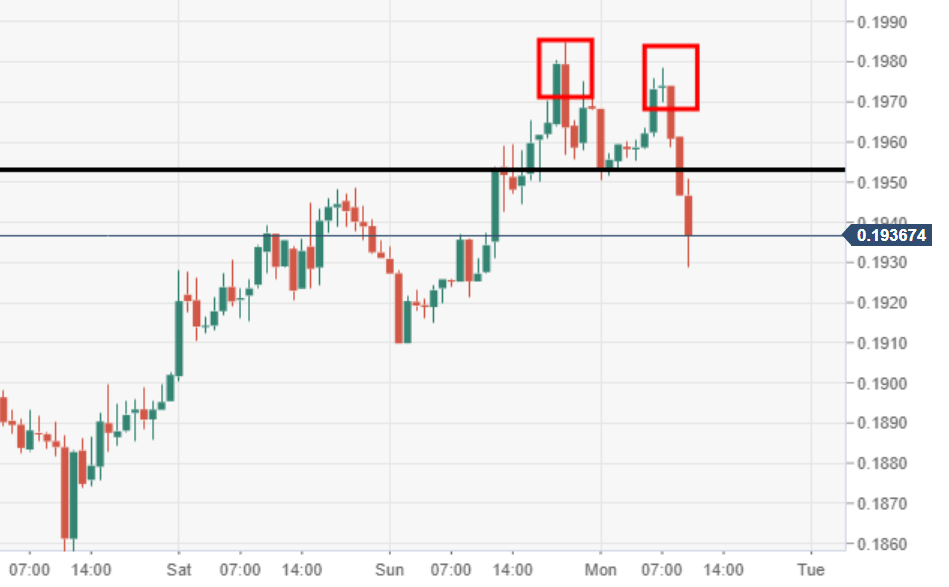
XRP/USD 60-minute chart
The price formed a near-term double top pattern, which has seen a break of the neckline and another wave of selling pressure.
.
Spot rate: 0.1875
Relative change: -1.90%
High: 0.1978
Low: 0.1928
Author

Ken Chigbo
Independent Analyst
Ken has over 8 years exposure to the financial markets. He started his career as an analyst, covering a variety of asset classes; forex, fixed income, commodities and equities.
More from Ken Chigbo


