Ripple's XRP Technical Analysis: XRP/USD if $0.32 is broken, there will be a total bloodshed
- Ripple's XRP is further suffering on Friday, after heavy selling pressure was triggered late on Thursday. Price down around 1.5%.
- XRP/USD price action is still worrying, moving within a bearish pennant structure.
- Bears are flirting with the psychological $0.3000 mark to the downside.

XRP/USD 60-minute chart
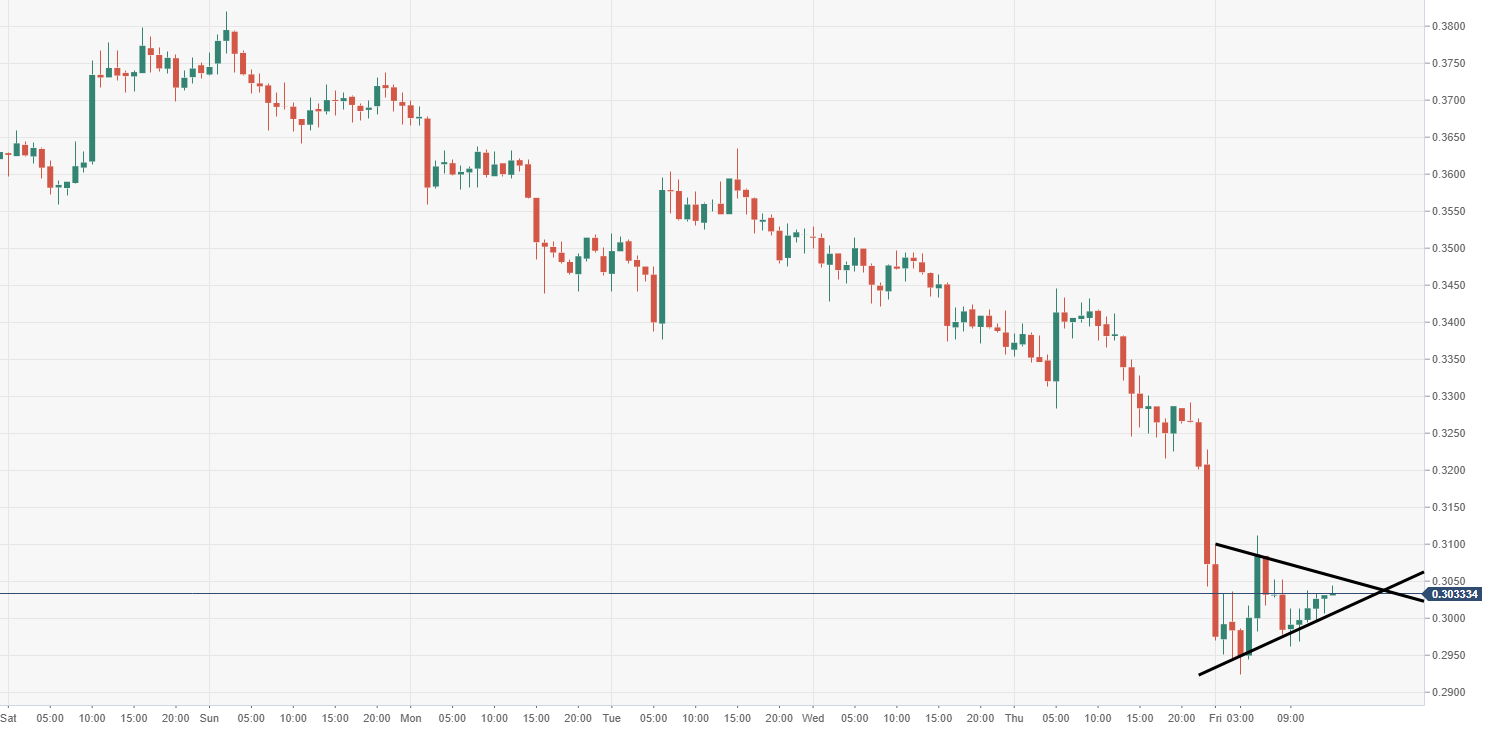
Spot rate: 0.3040
Relative change: -1.52%
High: 0.3227
Low: 0.2925
Trend: Bearish
Support 1: 0.3011, lower part of pennant.
Support 2: 0.2928, daily pivot point support.
Support 3: 0.2784, psychological support.
Resistance 1: 0.3057, upper part of pennant.
Resistance 2: 0.3332, daily pivot point resistance.
Resistance 3: 0.3591, daily pivot point resistance.
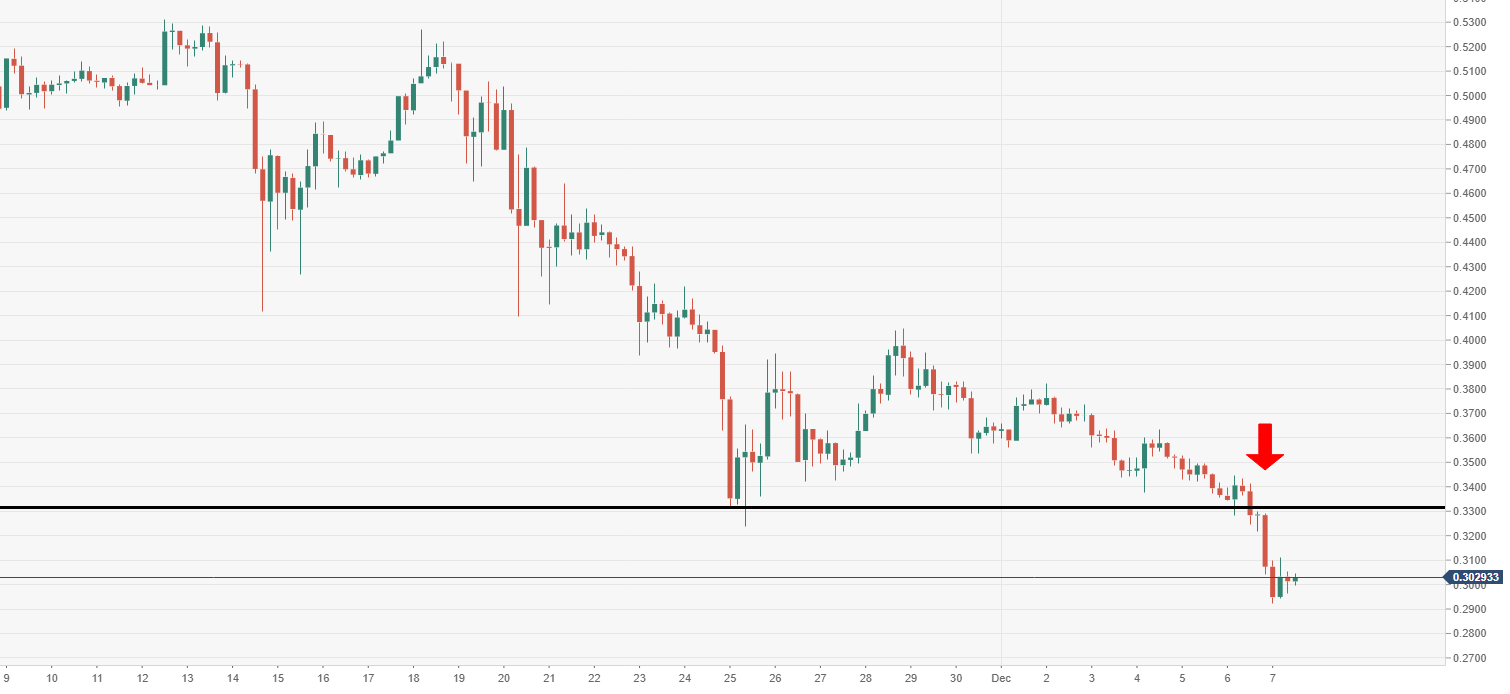
XRP/USD 4-hour chart
- Selling pressure intensified as the bears crashed through the recent bottom area around $0.3200 territory.
Author

Ken Chigbo
Independent Analyst
Ken has over 8 years exposure to the financial markets. He started his career as an analyst, covering a variety of asset classes; forex, fixed income, commodities and equities.


