Ripple's XRP Technical Analysis: XRP/USD if $0.32 is broken, there will be a total bloodshed
- Ripple XRP is trading down 2.8% in the latter part of Thursday's session.
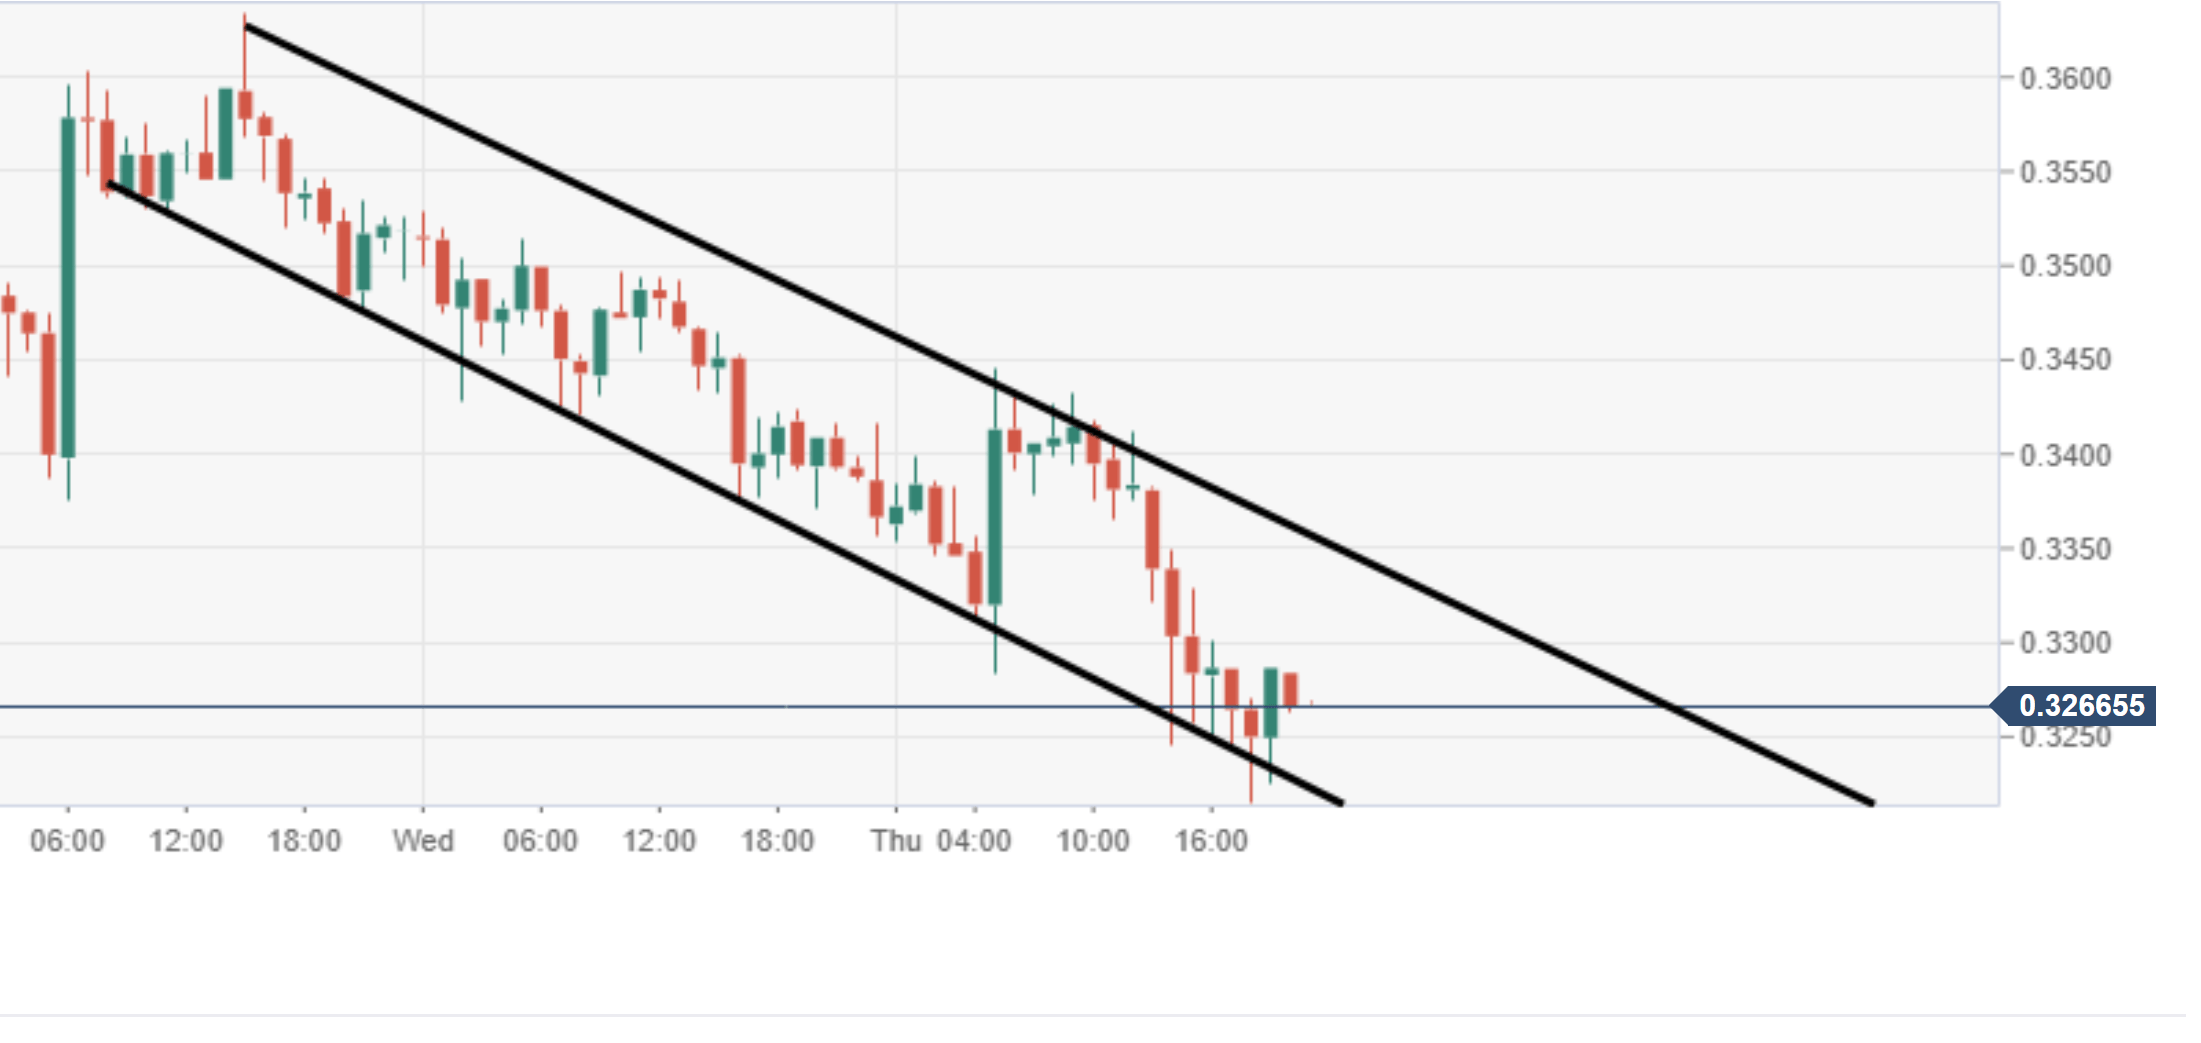
- XRP/USD bears are penetrating $0.3200 to the downside. This is the recent bottom area.
- A breach of the $0.3200 level will see a likely fall towards $0.2500 price territory.

XRP/USD daily chart
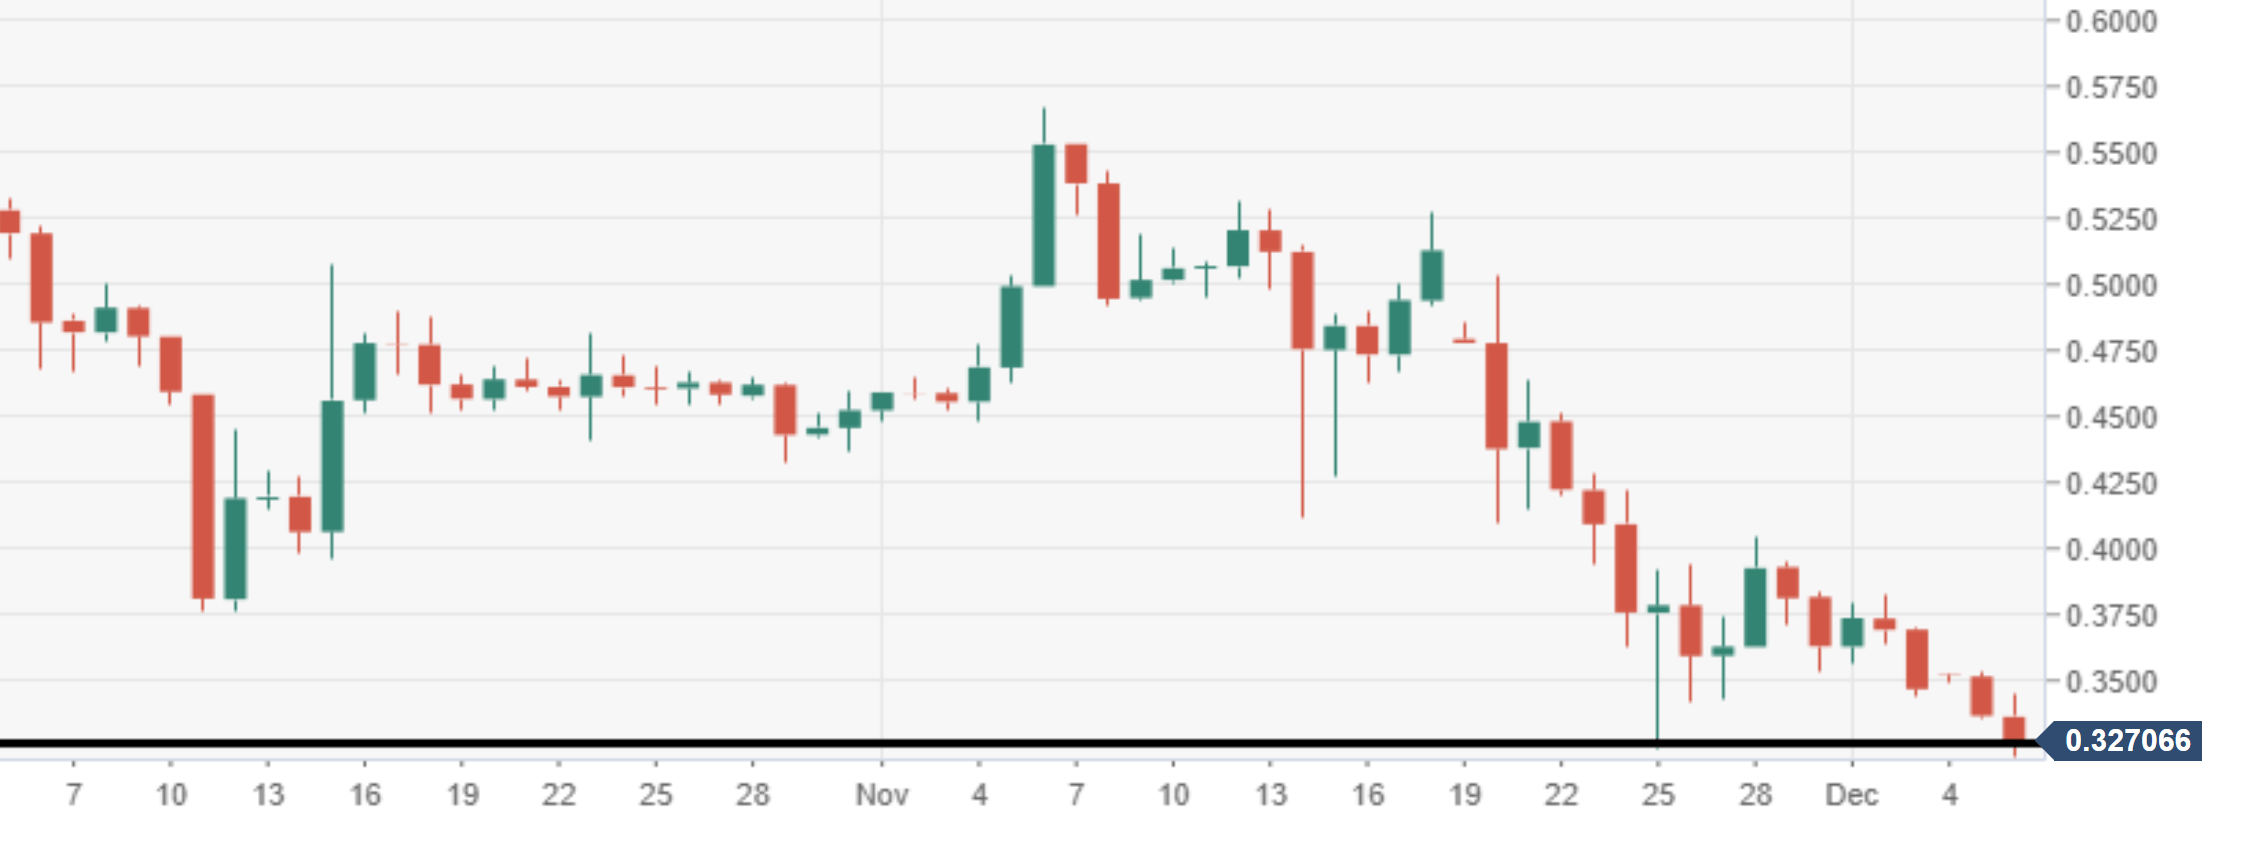
Spot rate: 0.3270
Relative change: -2.80%
High: 0.3440
Low: 0.3270
Trend: Bearish
Support 1: 0.3244, daily pivot point support.
Support 2: 0.3132, daily pivot point support.
Support 3: 0.3000, psychological support.
Resistance 1: 0.3479, daily pivot point resistance.
Resistance 2: 0.3591, daily pivot point resistance.
Resistance 3: 0.3652, daily pivot point resistance.
XRP/USD 60-minute chart
- XRP/USD price action via the 60-minute chart view can be seen moving within descending channel pattern.
Author

Ken Chigbo
Independent Analyst
Ken has over 8 years exposure to the financial markets. He started his career as an analyst, covering a variety of asset classes; forex, fixed income, commodities and equities.


