Hyperliquid Price Forecast: HYPE flashes breakout potential amid muted retail sentiment
- Hyperliquid edges higher from a key support level toward a key resistance trendline near $30.
- Derivatives data shows muted retail interest as Open Interest declines.
- The technical outlook is bullish in the short term, with focus near $30.

Hyperliquid (HYPE) inches closer to $30 at press time on Friday, extending the 1% rebound from the previous day. The recovery lacks market confidence, as HYPE futures Open Interest is declining, indicating risk-off sentiment among investors. Technically, HYPE approaches a crucial crossroads near $30 as a short-term increase in bullish momentum teases a potential upside breakout.
Derivatives data points to softened demand
Hyperliquid struggles to retain investor confidence in the short term amid broader pressure in the cryptocurrency market. Following the HIP-3 release, which offered futures trading of tokenized commodities on the Decentralized Exchange (DEX), the market awaits HIP-4, which is expected to introduce prediction markets.
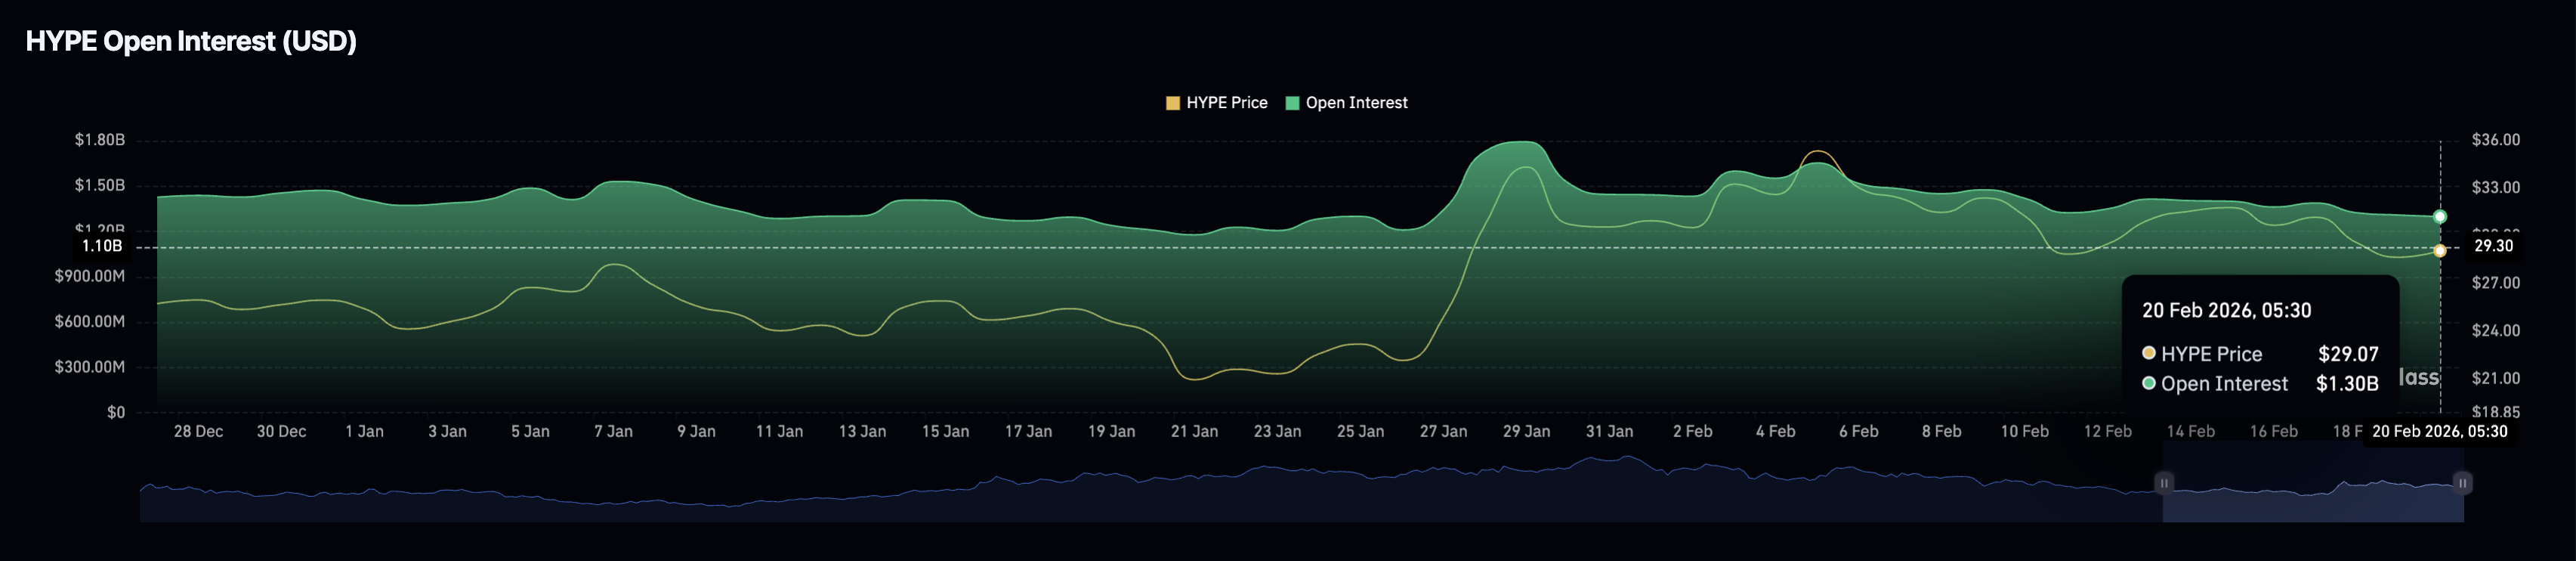
The HYPE futures market struggles to sustain bullish demand, leading to risk-off sentiment. CoinGlass data shows the HYPE Open Interest (OI) stood at $1.30 billion on Friday, continuing its steady decline as traders close positions (forced liquidation) or reduce leverage, pointing to reduced risk appetite.
Technical outlook: Will HYPE extend gains above $30?
Hyperliquid token is extending a rebound from the S1 pivot point at $28.15, testing the 200-period Exponential Moving Average (EMA) on the 4-hour chart at $29.50. At the time of writing, the perpetuals-focused DEX token is up 1% on Friday but remains below its 50- and 200-period EMAs, confirming a prevailing bearish bias.
The crucial resistance for the HYPE recovery is at the confluence of the 50-period EMA at $29.95 and the descending trendline near $30, which connects the highs on February 2 and February 16.
A potential close above $30 could drive the HYPE token rally toward the R1 pivot point at $33.40, suggesting a post-breakout upside of roughly 10%.
The Moving Average Convergence Divergence (MACD) has crossed above its signal line on the 4-hour chart, indicating renewed bullish momentum. At the same time, the Relative Strength Index (RSI) is at 48 on the same chart, edging higher as selling pressure wanes.
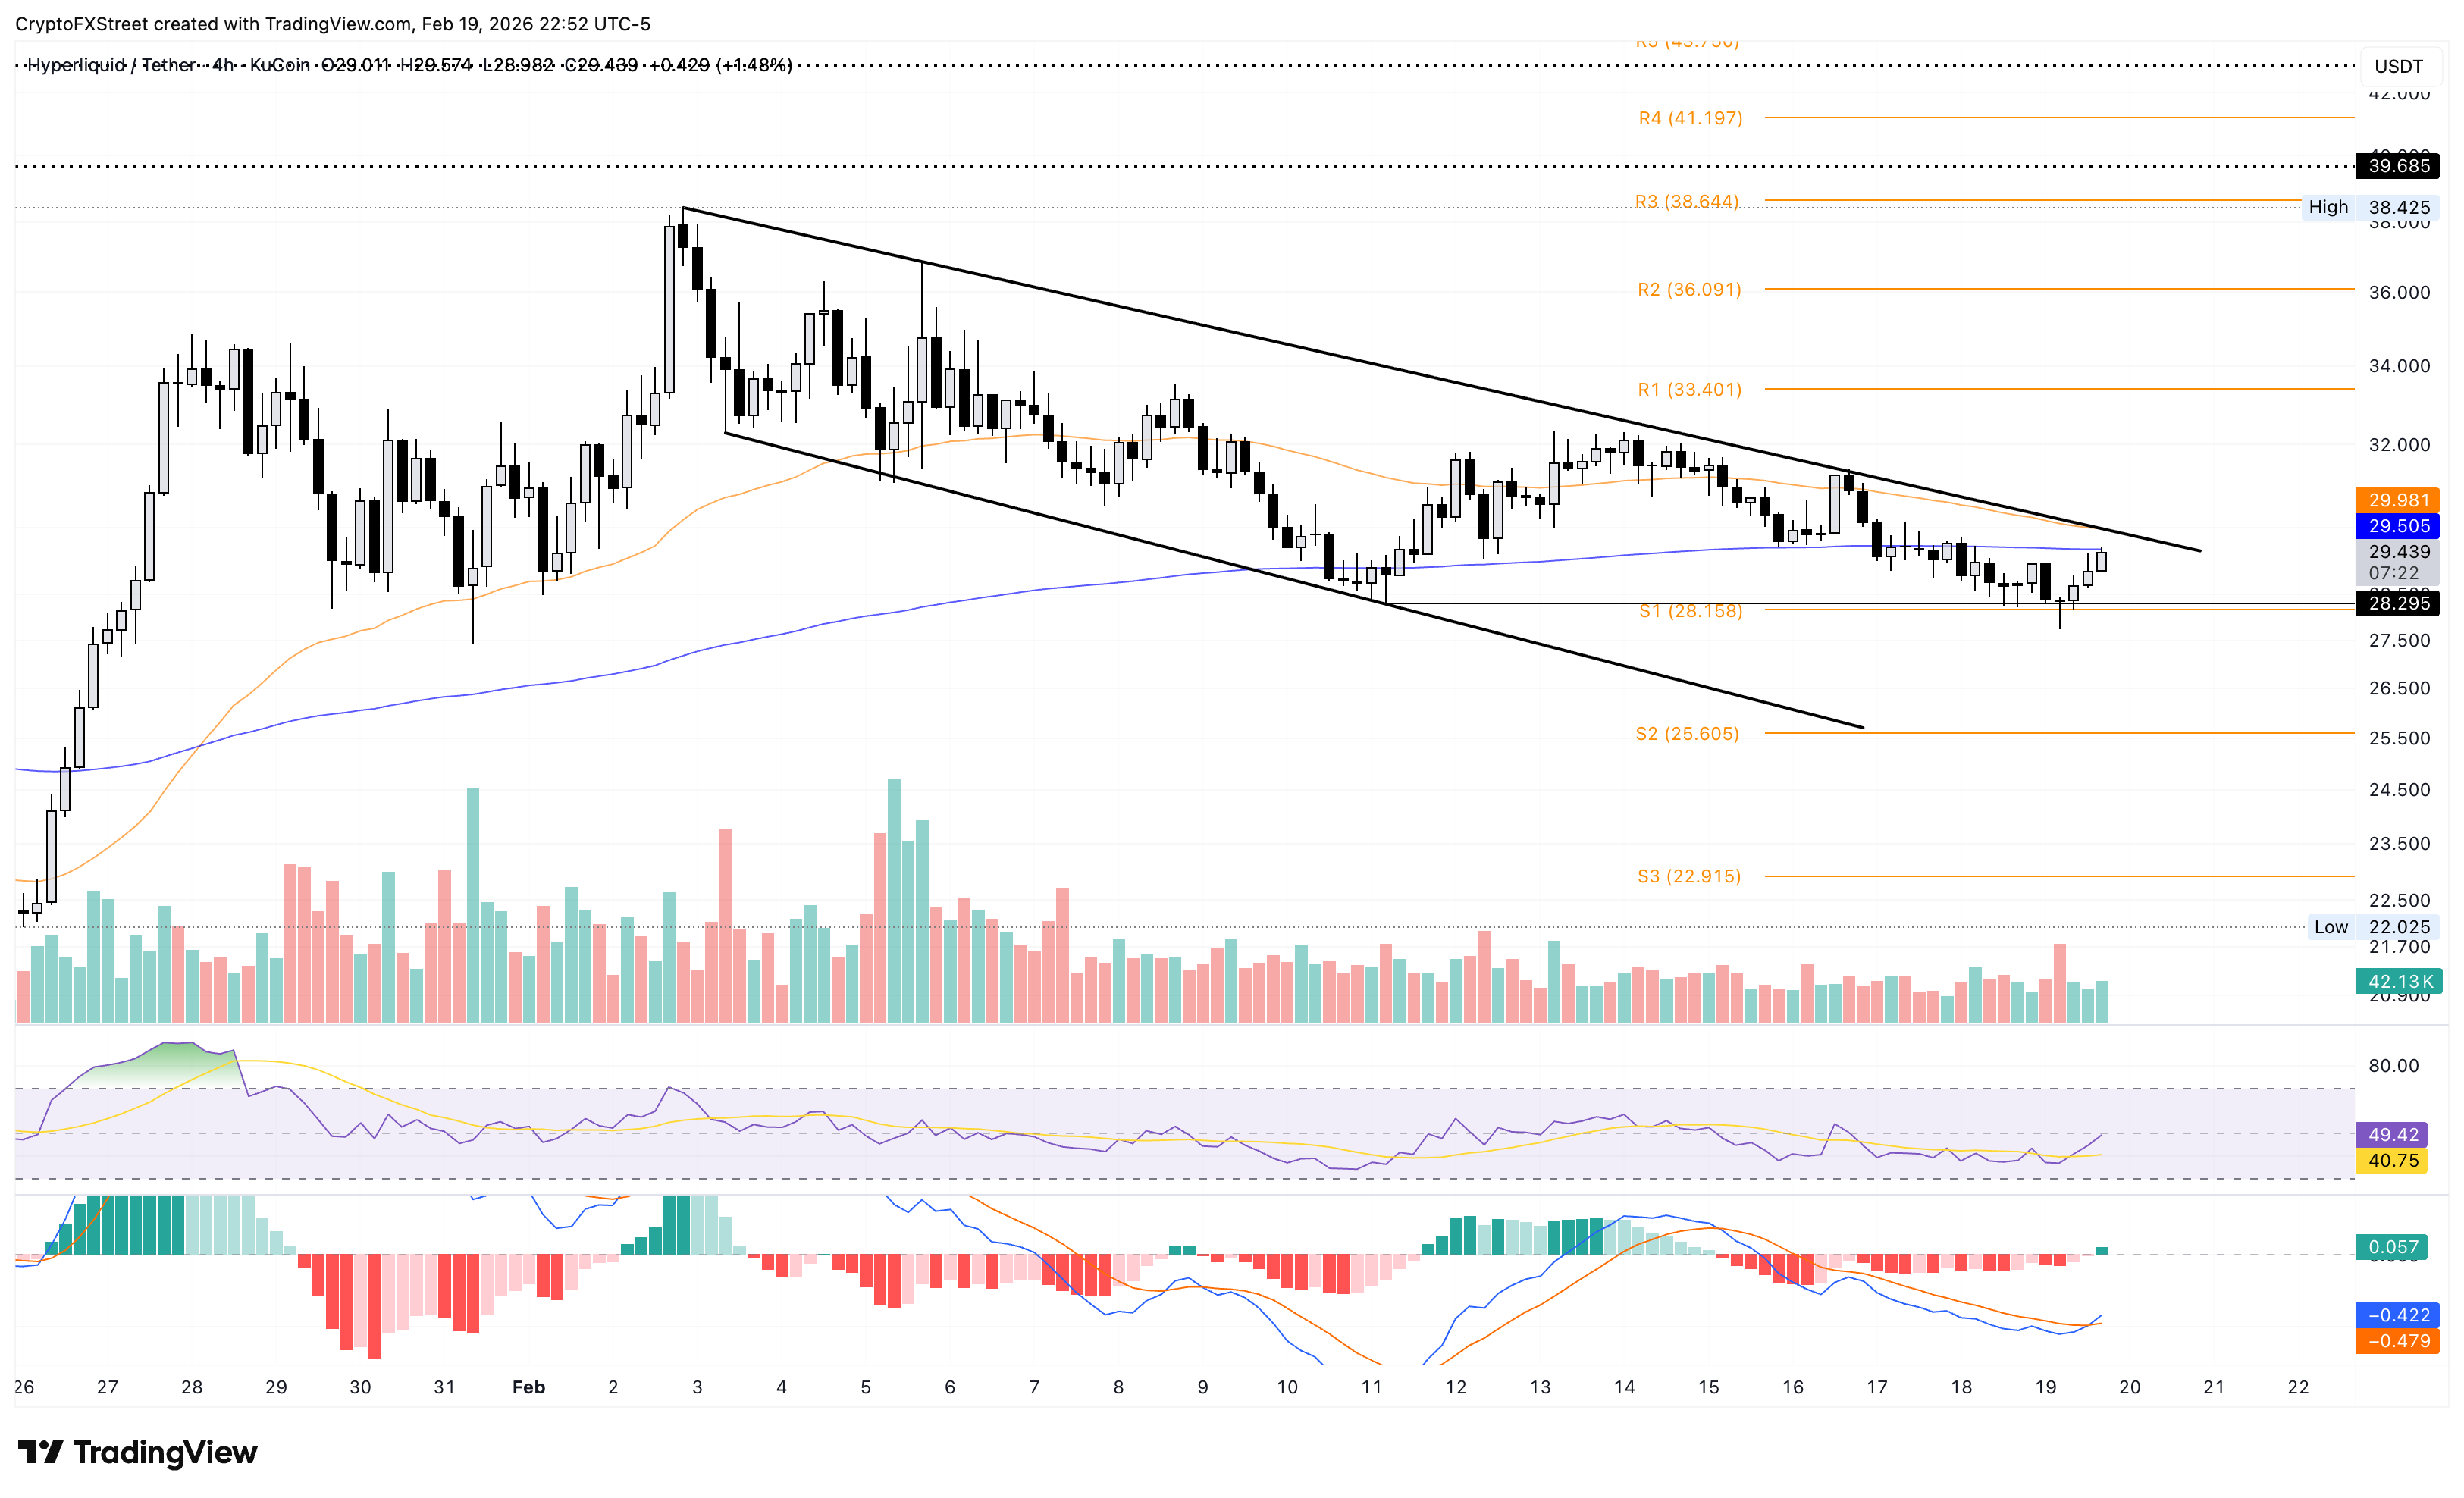
If Hyperliquid fails to sustain above $28.15, it could trigger a steeper decline toward the S2 pivot point at $25.60.
Author

Vishal Dixit
FXStreet
Vishal Dixit holds a B.Sc. in Chemistry from Wilson College but found his true calling in the world of crypto.