|

Ripple's XRP Technical Analysis: XRP/USD Does not have the juice for a $0.4000 breakout

  • Ripple's XRP trading marginally down in negative territory on Friday by 0.60%. 
  • XRP/USD is moving within a range of $0.39-0.33 since 28th December. 
  • The key for greater upside is the bulls breaking above $0.4000, which as it stands with current momentum, may not be seen for a while. 

XRP/USD 15-minute chart

  • The price broke out to the downside from a rising wedge pattern formation. 
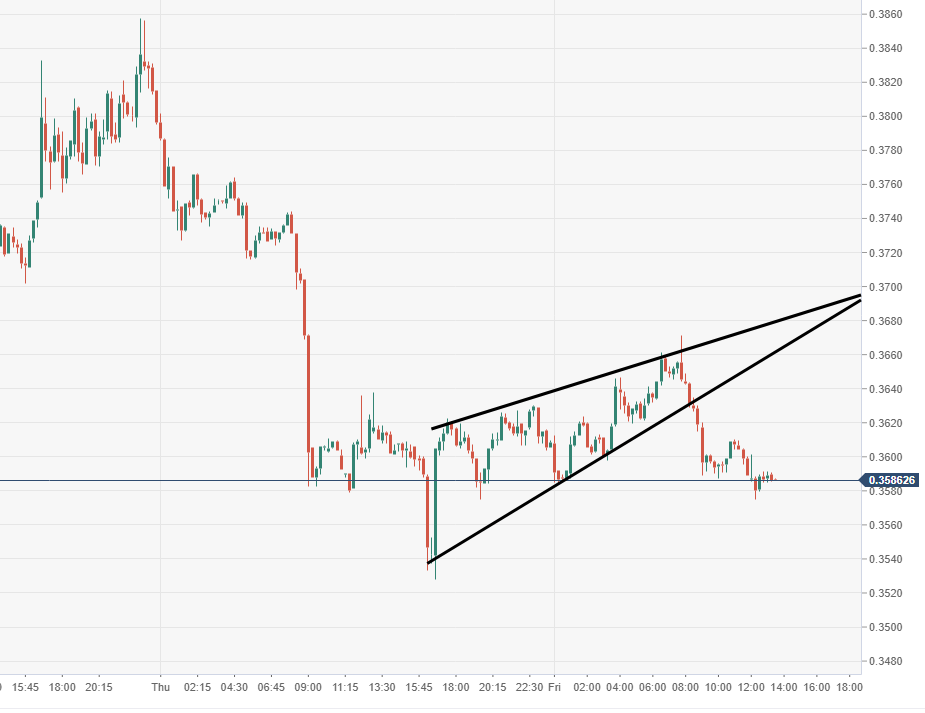
Spot rate:                  0.3587

Relative change:      -0.60%

High:                         0.3671

Low:                          0.3574

Trend:                        Bearish/Neutral 

Support 1:                  0.3490, daily pivot point support.

Support 2:                  0.3372, daily pivot point support.

Support 3:                  0.3216, daily pivot point support.

Resistance 1:             0.3764, daily pivot point resistance.

Resistance 2:             0.3920, daily pivot point resistance.

Resistance 3:             0.4038, daily pivot point resistance.

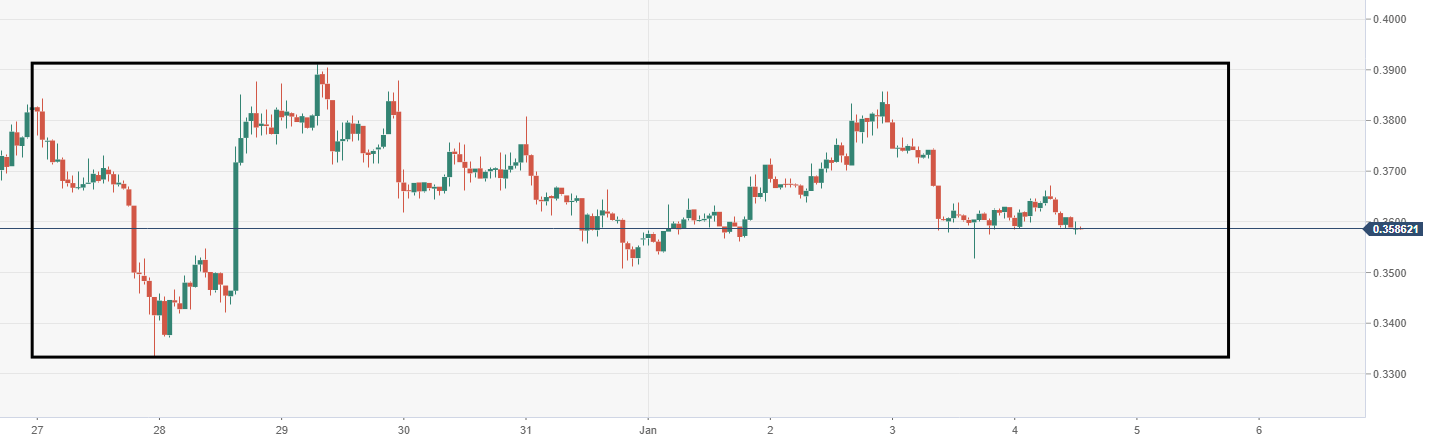
XRP/USD 60-minute chart 

  • Range can be seen a high tops at $0.3900 with the low at $0.3300, sine 28th December.
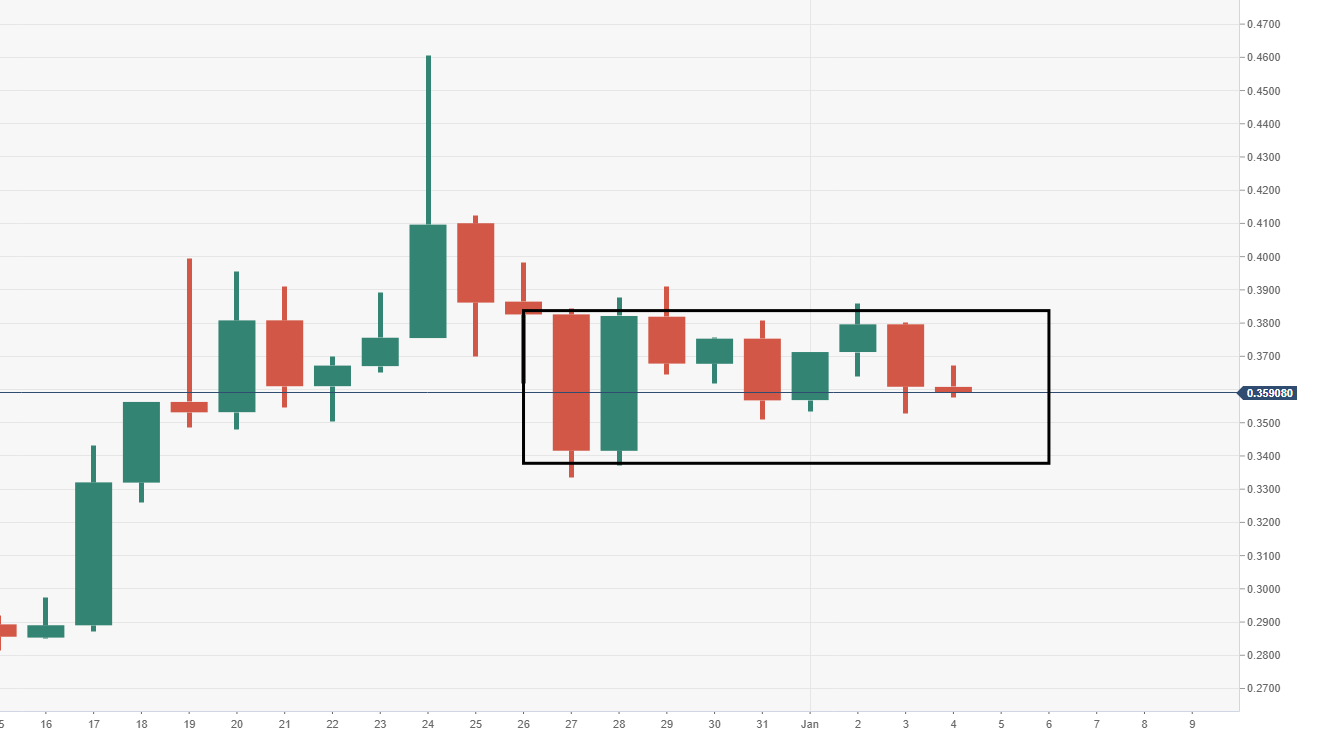
XRP/USD daily chart

  • Price action like a number of its peers is confined within a range-block formation. 

Author

Ken Chigbo

Ken Chigbo

Independent Analyst

Ken has over 8 years exposure to the financial markets. He started his career as an analyst, covering a variety of asset classes; forex, fixed income, commodities and equities.

More from Ken Chigbo
Share:

Editor's Picks

XRP pressured by weak ETF flows and declining retail interest

Ripple (XRP) is edging lower, trading above its intraday low of $1.32 at the time of writing on Tuesday. The decline from its weekly opening of $1.39 reflects heightened volatility in the broader cryptocurrency market, accentuated by tariff-triggered uncertainty.

Crypto Today: Bitcoin, Ethereum, XRP come under renewed pressure amid ETF outflows, tariff uncertainty

Bitcoin, Ethereum and Ripple are trading under increasing selling pressure at the time of writing on Tuesday, as market participants navigate renewed tariff uncertainty. The Crypto King holds above $63,000, down 2% intraday from its $64,656 open.

Bitcoin falls to two-week low as ETF outflows, tariff chaos weigh

Bitcoin price extends losses on Tuesday, ending a two-week consolidation phase. Risk-on sentiment fades amid growing uncertainty over Trump’s tariffs and rising US-Iran tensions, increasing downside risks toward $60,000.

Sui Price Forecast: SUI capitulates under pressure, opens the door to $0.70

Sui (SUI) declines by 3% at press time on Tuesday, extending the downside breakout of a short-consolidation range confirmed the previous day. Retail sentiment is bearish, as evidenced by increased long liquidations and a sharp drop in the funding rate. 

Bitcoin Price Annual Forecast: BTC holds long-term bullish structure heading into 2026

Bitcoin (BTC) is wrapping up 2025 as one of its most eventful years, defined by unprecedented institutional participation, major regulatory developments, and extreme price volatility.

Bitcoin: No recovery in sight

Bitcoin (BTC) price continues to trade within a range-bound zone, hovering around $67,000 at the time of writing on Friday, and falling slightly so far this week, with no signs of recovery.