|

Ripple's XRP technical analysis: XRP/USD dipping in critical a demand zone

  • Ripple's XRP price is trading with the red by some 3.00% in the session on Friday. 
  • XRP/USD is within the control of the market bears, running towards its sixth consecutive in the red. 
  • The price saw a big test of support at the $0.2500 mark, which has proven to attract buyers. 

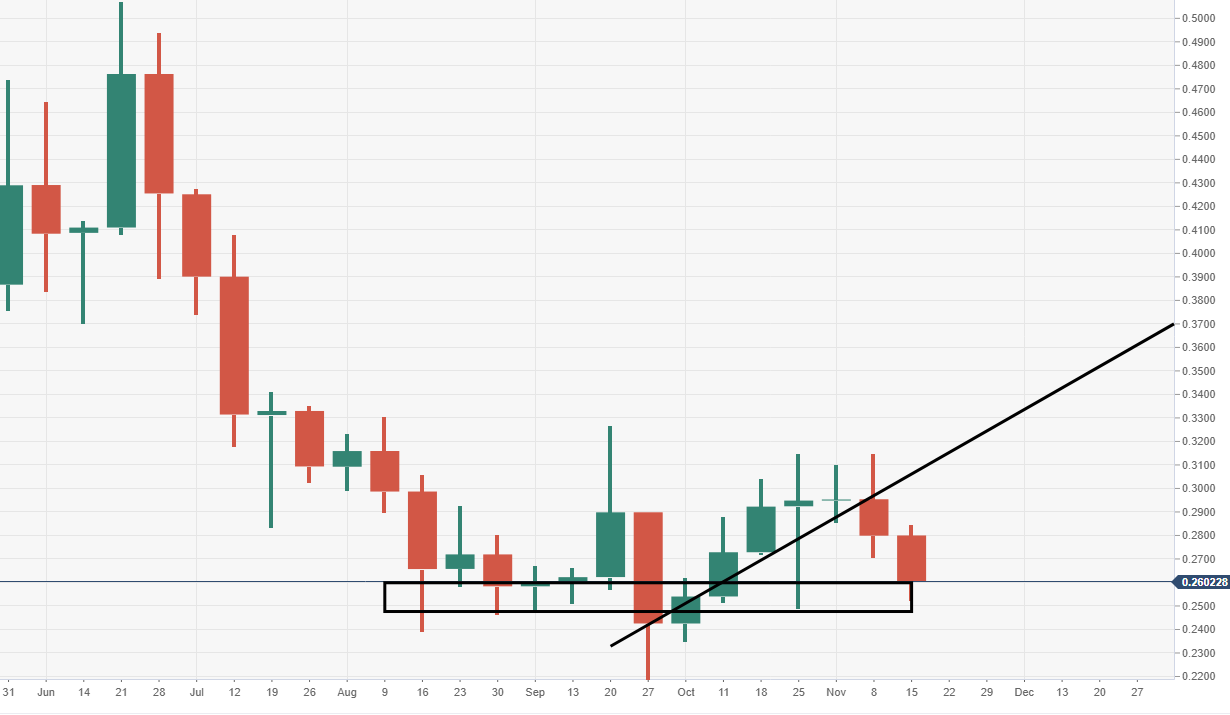
XRP/USD weekly chart

The price is set for a second consecutive week in the red after the October bull run lost momentum. 
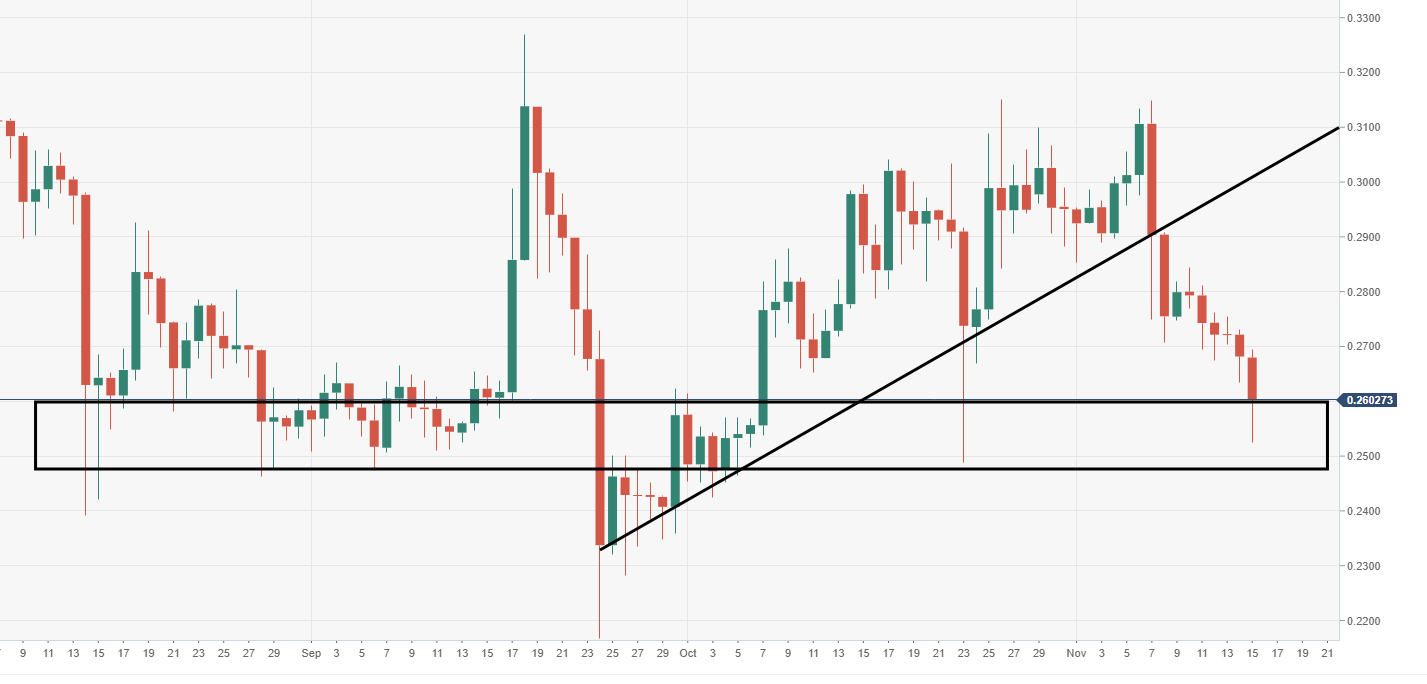
XRP/USD daily chart

The pressure has been very much to the downside since a critical ascending trend line break.

Spot rate:                 0.2602

Relative change:      -3.00%

High:                         0.2694

Low:                          0.2524

XRP/USD

Overview
Today last price0.2603
Today Daily Change-0.0079
Today Daily Change %-2.95
Today daily open0.2682
 
Trends
Daily SMA200.2892
Daily SMA500.2777
Daily SMA1000.2753
Daily SMA2000.3237
 
Levels
Previous Daily High0.2731
Previous Daily Low0.2634
Previous Weekly High0.3149
Previous Weekly Low0.2707
Previous Monthly High0.315
Previous Monthly Low0.2425
Daily Fibonacci 38.2%0.2671
Daily Fibonacci 61.8%0.2694
Daily Pivot Point S10.2634
Daily Pivot Point S20.2585
Daily Pivot Point S30.2537
Daily Pivot Point R10.273
Daily Pivot Point R20.2779
Daily Pivot Point R30.2827

Author

Ken Chigbo

Ken Chigbo

Independent Analyst

Ken has over 8 years exposure to the financial markets. He started his career as an analyst, covering a variety of asset classes; forex, fixed income, commodities and equities.

More from Ken Chigbo
Share:

Editor's Picks

Ripple bulls defend key support amid waning retail demand and ETF inflows

XRP ticks up above $1.40 support, but waning retail demand suggests caution. XRP attracts $4 million in spot ETF inflows on Thursday, signaling renewed institutional investor interest.

Crypto Today: Bitcoin, Ethereum, XRP rebound as risk appetite improves

Bitcoin rises marginally, nearing the immediate resistance of $68,000 at the time of writing on Friday. Major altcoins, including Ethereum and Ripple, hold key support levels as bulls aim to maintain marginal intraday gains.

Bitcoin Weekly Forecast: No recovery in sight 

Bitcoin price continues to trade sideways between $65,729 and $71,746, extending its consolidation since February 7. US-spot ETFs record an outflow of $403.90 million through Thursday, pointing to the fifth consecutive week of withdrawals.

Pi Network Price Forecast: PI recovery stalls amid profit-taking

Pi Network tests 50-day EMA support on Friday, after a 5% decline the previous day. PiScan data shows large deposits on CEXs totaling over 4 million PI tokens in the last 24 hours, reflecting an exodus of investors taking profits.

Bitcoin Price Annual Forecast: BTC holds long-term bullish structure heading into 2026

Bitcoin (BTC) is wrapping up 2025 as one of its most eventful years, defined by unprecedented institutional participation, major regulatory developments, and extreme price volatility.

Bitcoin: No recovery in sight

Bitcoin (BTC) price continues to trade within a range-bound zone, hovering around $67,000 at the time of writing on Friday, and falling slightly so far this week, with no signs of recovery.