|

Ripple's XRP technical analysis: XRP/USD bears force daily flag breakout

  • Ripple's XRP price is trading with the red by some 5.50% in the session on Friday. 
  • XRP/USD has breached an ascending channel/bearish flag via the daily.
  • The failure of the bulls attempting to break $0.3000 has invited selling pressure. 

XRP/USD weekly chart

XRP bears are pressing to end the five consecutive weeks of gains that the bulls had enjoyed. 
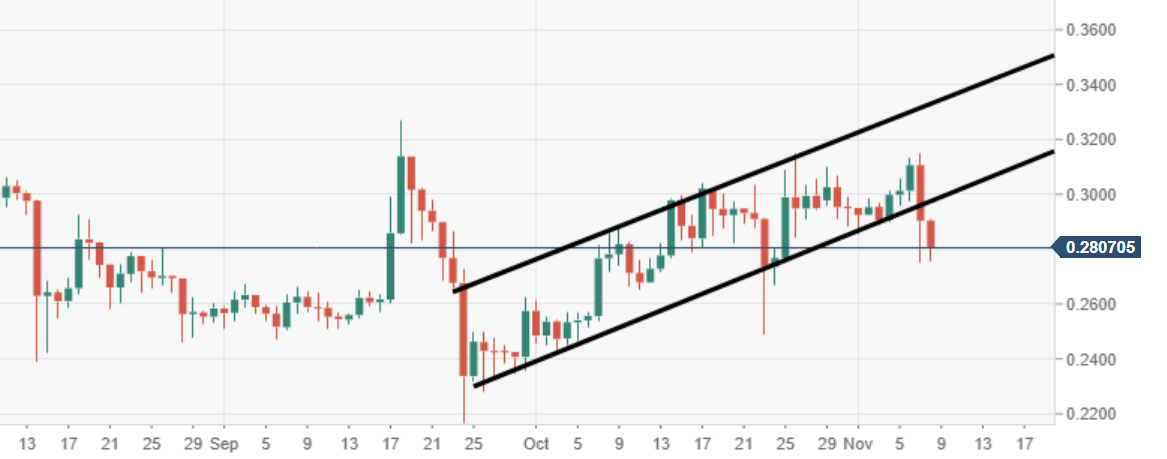
XRP/USD daily chart

Price action via the daily has breached a bearish flag structure, inviting further selling pressure. 

Spot rate:                  0.2742      

Relative change:      -5.55%

High:                         0.2908

Low:                          0.2755 

XRP/USD

Overview
Today last price0.2725
Today Daily Change-0.0179
Today Daily Change %-6.16
Today daily open0.2904
 
Trends
Daily SMA200.2942
Daily SMA500.2788
Daily SMA1000.2783
Daily SMA2000.3249
 
Levels
Previous Daily High0.3149
Previous Daily Low0.2749
Previous Weekly High0.31
Previous Weekly Low0.2854
Previous Monthly High0.315
Previous Monthly Low0.2425
Daily Fibonacci 38.2%0.2902
Daily Fibonacci 61.8%0.2996
Daily Pivot Point S10.2718
Daily Pivot Point S20.2533
Daily Pivot Point S30.2317
Daily Pivot Point R10.3119
Daily Pivot Point R20.3335
Daily Pivot Point R30.352

Author

Ken Chigbo

Ken Chigbo

Independent Analyst

Ken has over 8 years exposure to the financial markets. He started his career as an analyst, covering a variety of asset classes; forex, fixed income, commodities and equities.

More from Ken Chigbo
Share:

Editor's Picks

Ripple bulls defend key support amid waning retail demand and ETF inflows

XRP ticks up above $1.40 support, but waning retail demand suggests caution. XRP attracts $4 million in spot ETF inflows on Thursday, signaling renewed institutional investor interest.

Crypto Today: Bitcoin, Ethereum, XRP rebound as risk appetite improves

Bitcoin rises marginally, nearing the immediate resistance of $68,000 at the time of writing on Friday. Major altcoins, including Ethereum and Ripple, hold key support levels as bulls aim to maintain marginal intraday gains.

Bitcoin Weekly Forecast: No recovery in sight 

Bitcoin price continues to trade sideways between $65,729 and $71,746, extending its consolidation since February 7. US-spot ETFs record an outflow of $403.90 million through Thursday, pointing to the fifth consecutive week of withdrawals.

Pi Network Price Forecast: PI recovery stalls amid profit-taking

Pi Network tests 50-day EMA support on Friday, after a 5% decline the previous day. PiScan data shows large deposits on CEXs totaling over 4 million PI tokens in the last 24 hours, reflecting an exodus of investors taking profits.

Bitcoin Price Annual Forecast: BTC holds long-term bullish structure heading into 2026

Bitcoin (BTC) is wrapping up 2025 as one of its most eventful years, defined by unprecedented institutional participation, major regulatory developments, and extreme price volatility.

Bitcoin: No recovery in sight

Bitcoin (BTC) price continues to trade within a range-bound zone, hovering around $67,000 at the time of writing on Friday, and falling slightly so far this week, with no signs of recovery.