Ripple's XRP Technical Analysis: XRP/USD bearish flag formation eyed
- Ripple's price on Friday trading down around 2% in the second half of the session.
- 60-minute chart view points to another potential break south, with a bear flag structure eyed.

XRP/USD 15-minute chart
- Buyers being found near-term from 0.3225-0.3250 range, via 15-minute view.
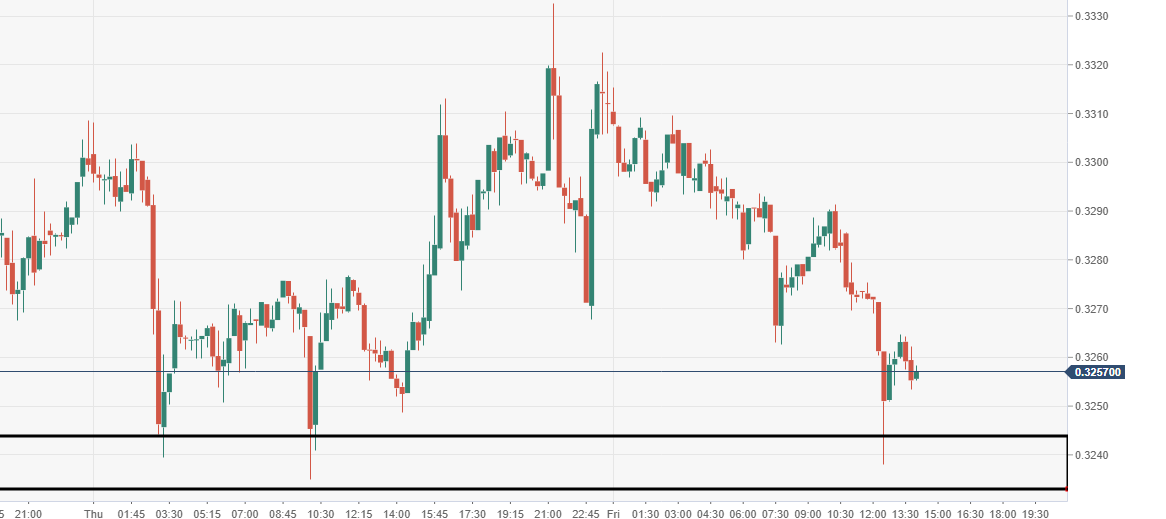
Spot rate: 0.3254
Relative change: -1.95%
High: 0.3315
Low: 0.3237
Trend: Bearish
Support 1: 0.3254, daily pivot point support.
Support 2: 0.3196, daily pivot point support.
Support 3: 0.3156, daily pivot point support.
Resistance 1: 0.3351, daily pivot point resistance.
Resistance 2: 0.3391, daily pivot point resistance.
Resistance 3: 0.3449, daily pivot point resistance.
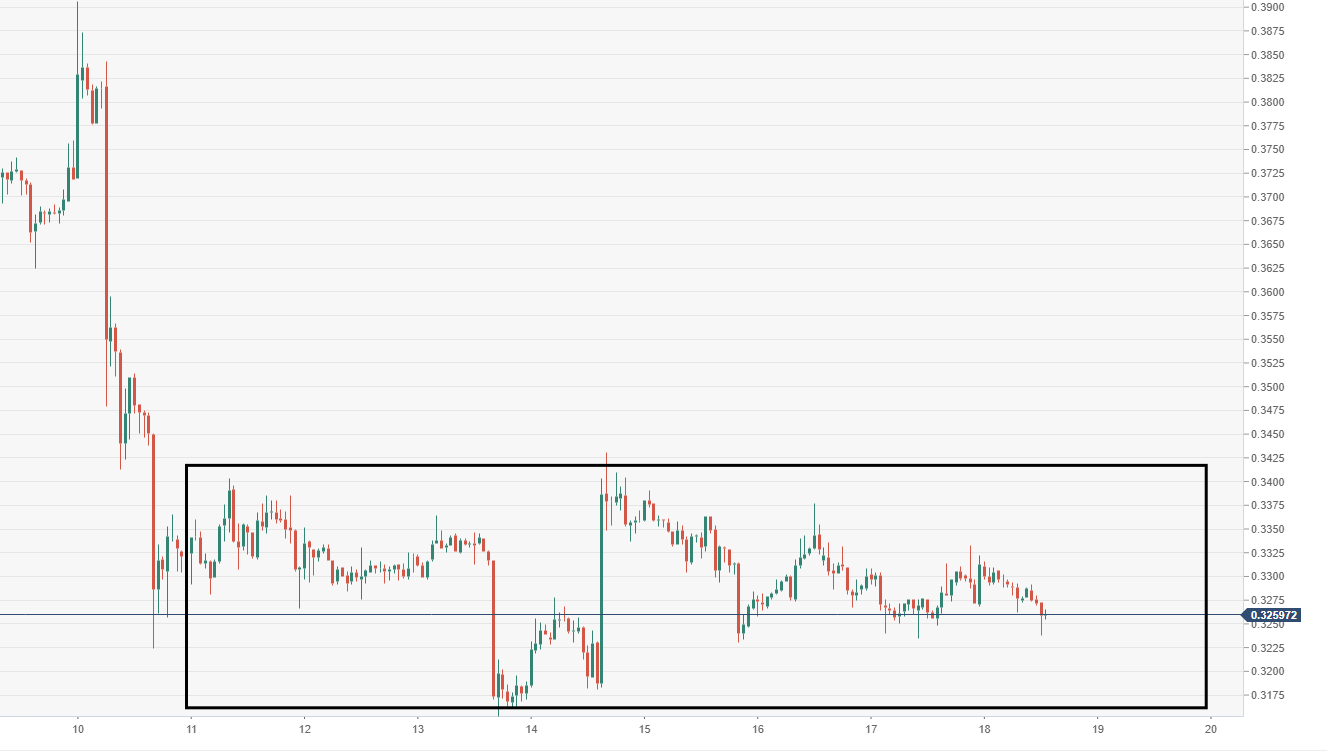
XRP/USD 60-minute chart
- A potential bearish flag formation, gearing up for another break south.
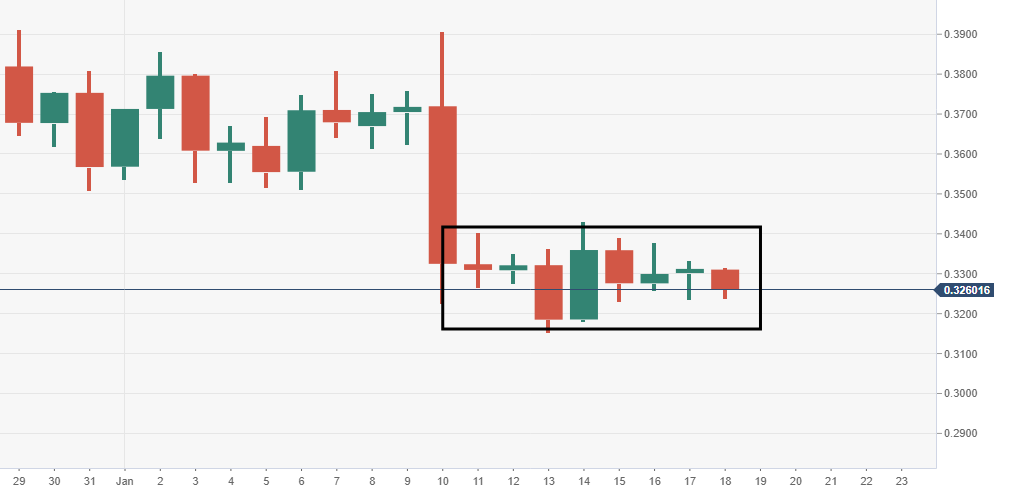
XRP/USD daily chart
- Price remains stuck within the confinements of the mundane 8 session range.
Author

Ken Chigbo
Independent Analyst
Ken has over 8 years exposure to the financial markets. He started his career as an analyst, covering a variety of asset classes; forex, fixed income, commodities and equities.


