- Ripple's XRP is trading up on Friday by some 1.3%, in the second half of the session.
- XRP/USD price action has formed a bearish flag/wedge pattern across the 60-minute and daily time frame.
XRP/USD 15-minute chart
- Price action moving within and respecting a rising channel pattern formation.
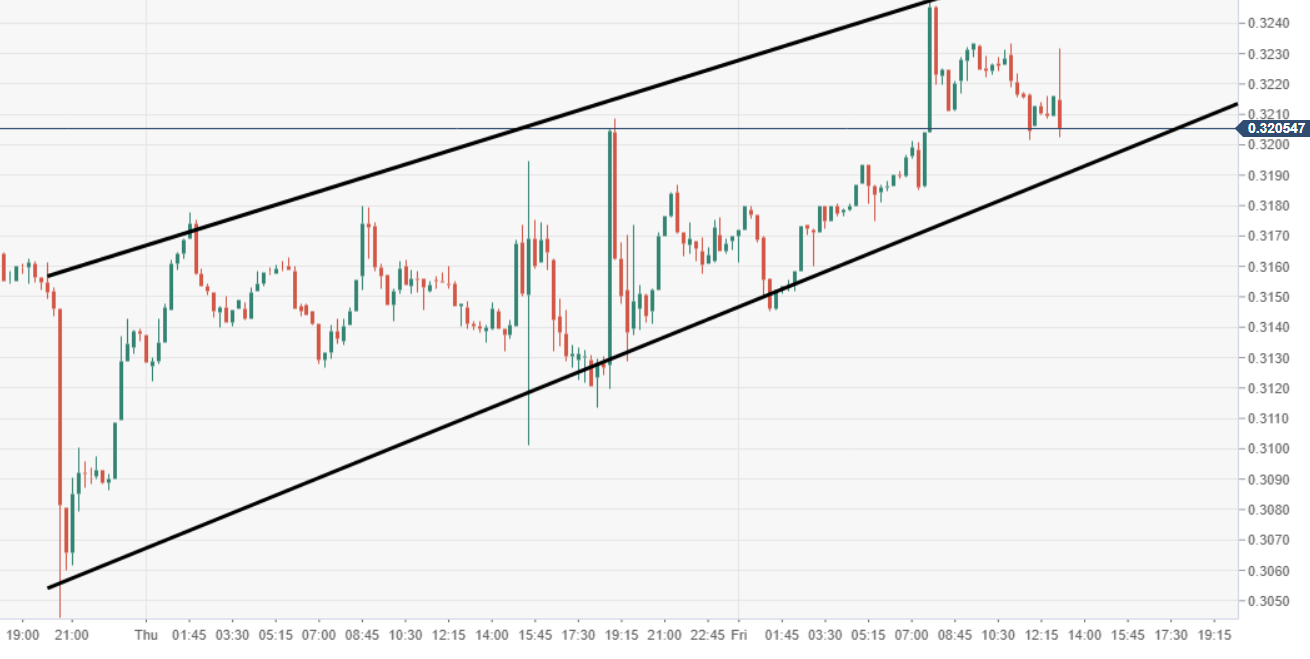
Spot rate: 0.3208
Relative change: +1.30%
High: 0.3248
Low: 0.3145
Trend: Neutral/Bearish
Trends:
Daily SMA20: 0.3146
Daily SMA50: 0.315
Daily SMA100: 0.3364
Daily SMA200: 0.3775
Levels:
Previous Daily High: 0.3209
Previous Daily Low: 0.3101
Previous Weekly High: 0.3505
Previous Weekly Low: 0.2982
Previous Monthly High: 0.3505
Previous Monthly Low: 0.2879
Daily Fibonacci 38.2%: 0.3168
Daily Fibonacci 61.8%: 0.3142
Daily Pivot Point S1: 0.3111
Daily Pivot Point S2: 0.3052
Daily Pivot Point S3: 0.3003
Daily Pivot Point R1: 0.3219
Daily Pivot Point R2: 0.3268
Daily Pivot Point R3: 0.3326
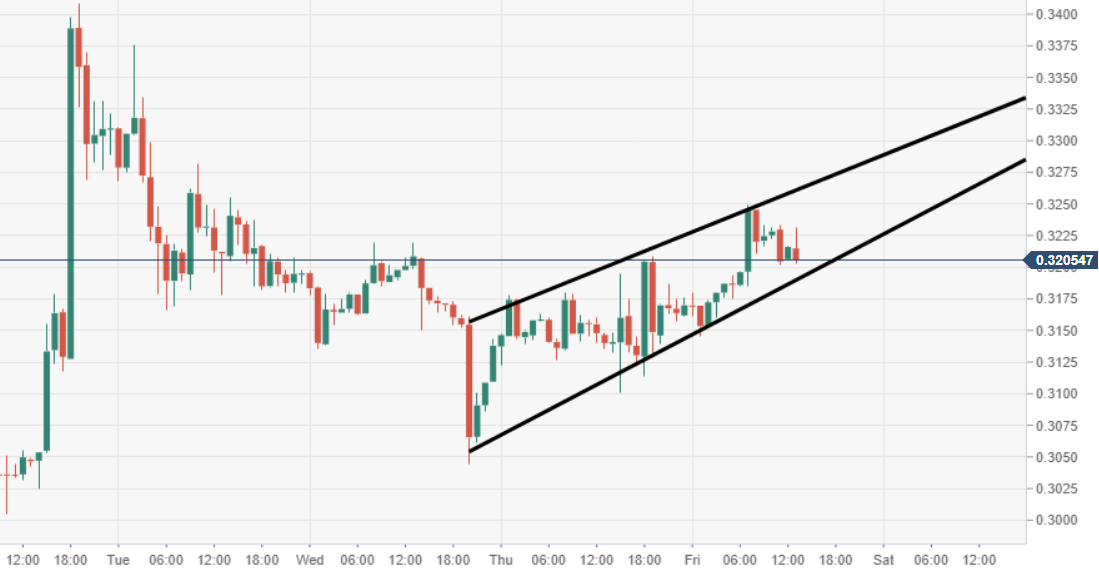
XRP/USD 60-minute chart
- Rising wedge or somewhat of a bearish flag pattern formation can be observed via the 60-minute.
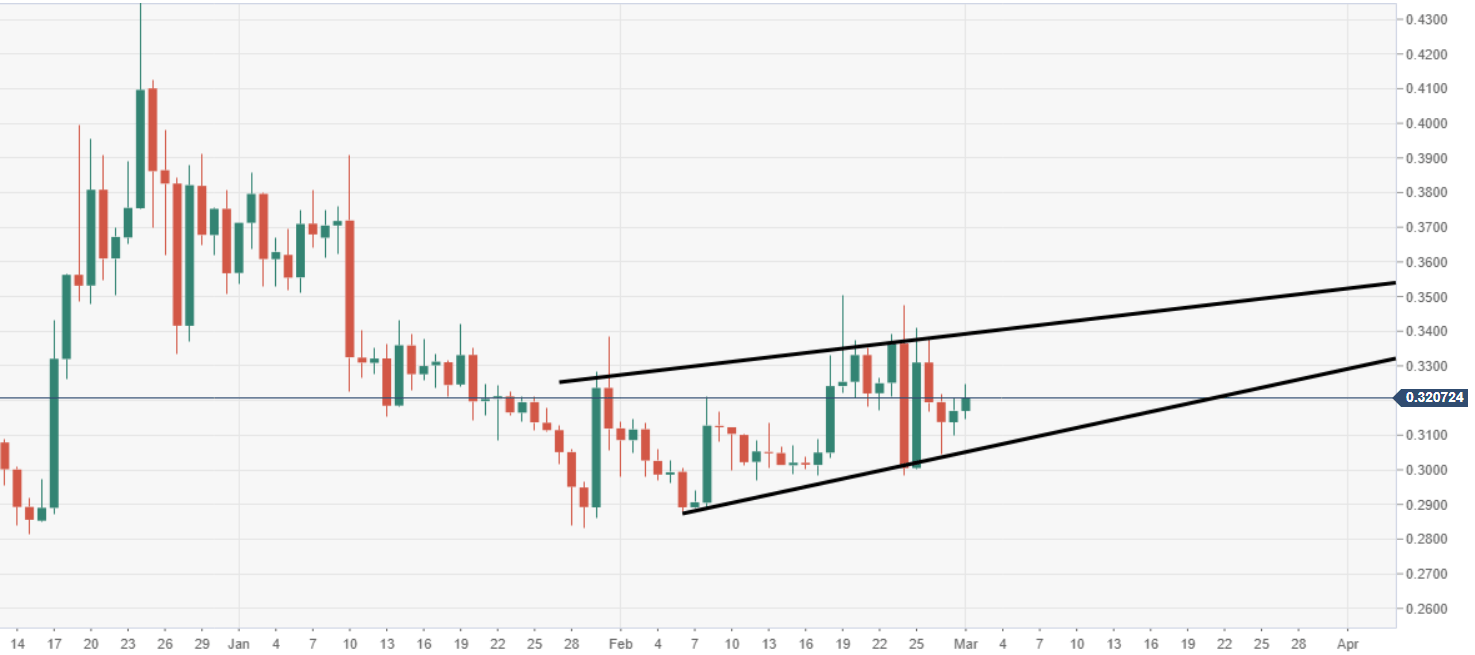
XRP/USD daily chart
- Price action via the daily remains somewhat subdued, trading within a rising wedge formation.
Information on these pages contains forward-looking statements that involve risks and uncertainties. Markets and instruments profiled on this page are for informational purposes only and should not in any way come across as a recommendation to buy or sell in these assets. You should do your own thorough research before making any investment decisions. FXStreet does not in any way guarantee that this information is free from mistakes, errors, or material misstatements. It also does not guarantee that this information is of a timely nature. Investing in Open Markets involves a great deal of risk, including the loss of all or a portion of your investment, as well as emotional distress. All risks, losses and costs associated with investing, including total loss of principal, are your responsibility. The views and opinions expressed in this article are those of the authors and do not necessarily reflect the official policy or position of FXStreet nor its advertisers.
Latest Crypto News & Analysis
Editors’ Picks
BREAKING: Ethereum price hits new all-time high above $2,550
Ethereum price just had a breakout above the previous all-time high at $2,548 and faces no resistance ahead. The digital asset has been outperforming the market for the past two days and it's leading the other coins. The next most significant price target for ETH will be $3,000.
Cardano could slip to a two-month low if key level cracks
Cardano has been trading somewhat sideways for the past two months and established a massive resistance trendline around $1.5. The digital asset could be on the brink of a significant leg down if bulls can’t hold key support level.
Bitcoin hints at following ETH’s explosive rally, XRP indecisive
Bitcoin price seems to be coiling up for an upswing as it trades around a crucial support level. Ethereum, on the other hand, has already seen a massive run-up that might retest its local top. Unlike BTC or ETH, XRP shows signs of a drop from a technical perspective.
Dogecoin loses momentum, but upswing could still evolve
Dogecoin price crashes 35% after the hyped “dogeday420” fails to gather steam. Despite losing its upswing momentum, the meme coin could still surge if it bounces off the immediate demand. On-chain metrics point to a grim outlook for DOGE.
Bitcoin Weekly Forecast: Institutional wave of BTC adoption follows new all-time highs
Bitcoin price hitting a new all-time high and Coinbase’s direct listing are perhaps two of the most important developments surrounding the pioneer cryptocurrency over the past week.