Ripple (XRP/USD) Technical Analysis: 60-minute Chart View Remains Bearish, Near-term Support Being Tested
- Ripple price under further pressure on Friday, nursing losses over 1.5% in the session.
- XRP/USD has faced several rejections over the past four sessions, attempting a breaking back above $0.5000 area.
- Price moving within a sideways wedge pattern, with the lower support being tested to the downside.

XRP/USD 60-minute chart
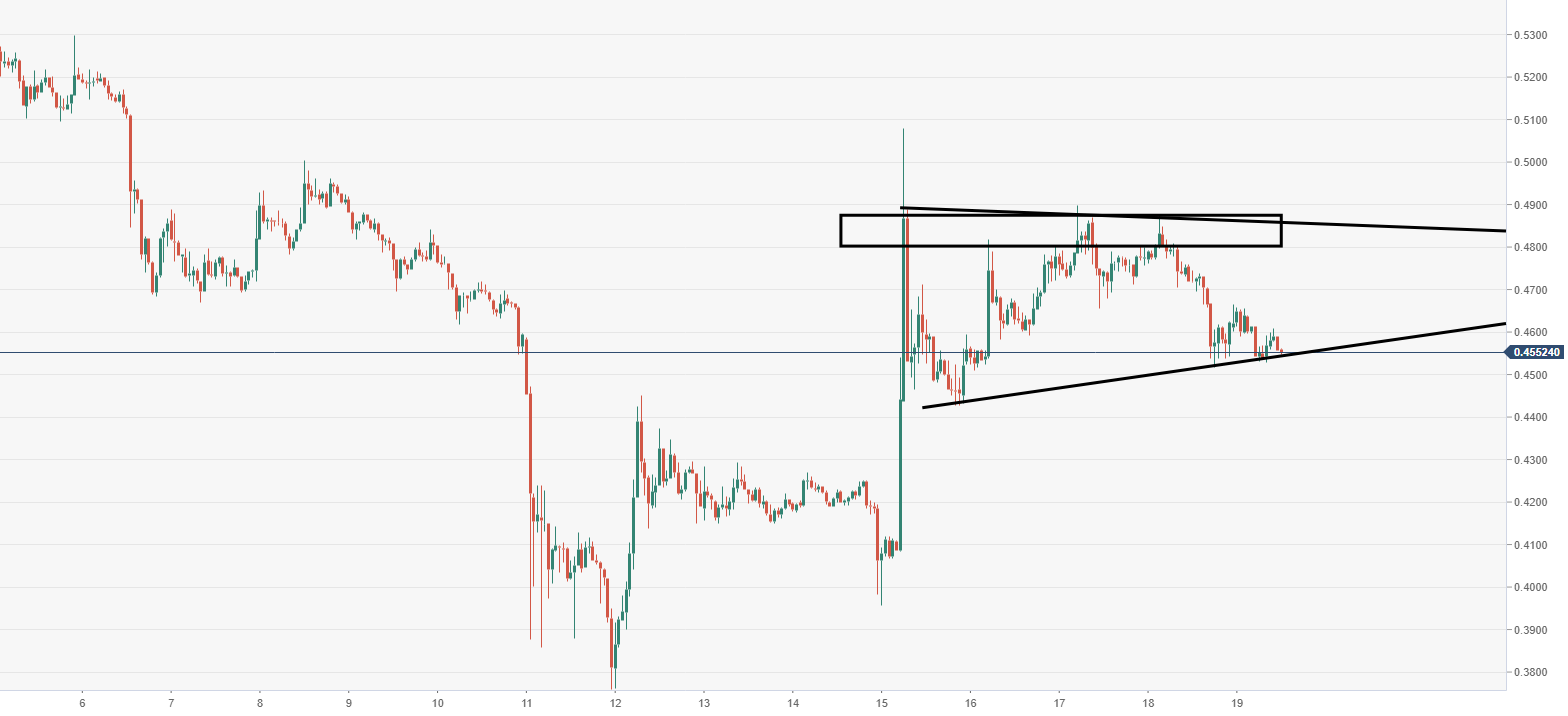
Spot rate: 0.45515
Relative change: -1.65%
High: 0.46549
Low: 0.45285
Trend: Bearish
Support 1: 0.453000, lower supporting trend line.
Support 2: 0.44330, support on 60-minute chart.
Support 3: 0.39610, 15 October low.
Resistance 1: 0.46521, resistance on 60-minute chart.
Resistance 2: 0.48280, upper trend line and supply area.
Resistance 3: 0.48700, double top area.
Author

Ken Chigbo
Independent Analyst
Ken has over 8 years exposure to the financial markets. He started his career as an analyst, covering a variety of asset classes; forex, fixed income, commodities and equities.


