Ripple to continue uptrend in 2022 with investors ready to break out of pennant
- XRP price keeps respecting the longer-term green ascending trend line for the fourth consecutive week.
- To the upside, some moving averages are weighing on upside potential.
- Expect investors to wait for the perfect entry before the rally starts in 2022.

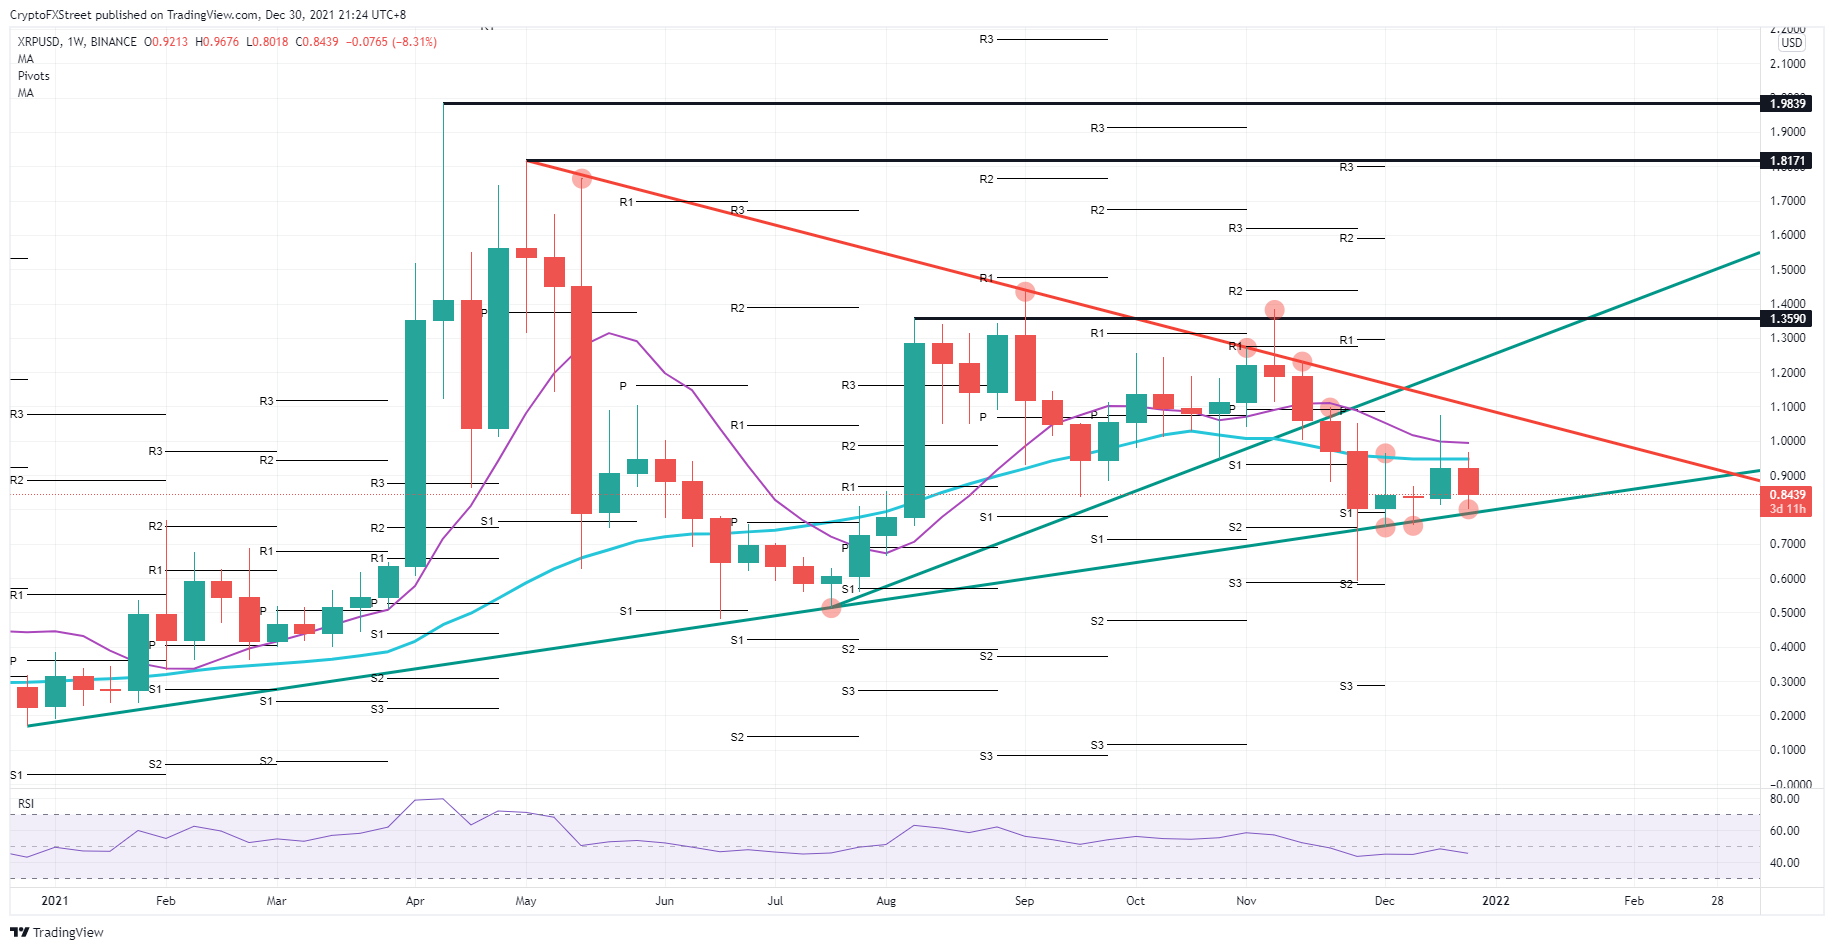
Ripple (XRP) is respecting both boundaries from both the upside and the downside, as the price action is in a weekly pennant with on the topside a red descending triangle from May and from below an ascending green trend line is giving support from December 2020. Although XRP price action looks more bearish, the green ascending trend line has been held on several occasions with good respect. Expect a possible brush against the ascending trend line to come in the first weeks of 2022 that will act as the starting point for the bull run that could shoot XRP back towards $1.36.
XRP is on the verge of a bull run in 2022
XRP price shows some signs of a more bearish trend with the last few weeks multiple tests on the green ascending trend line that has been forming the uptrend support throughout 2021. Each time a test saw a firm bounce off that trend line, the descending Simple Moving Averages (SMA) are posing a bit of a cap to further upside potential. Although this looks bearish, do not be fooled as bulls are patiently buying into the price action as the Relative Strenght Index keeps a moderate trend around 50 and has not dipped towards the oversold area throughout the year.
Investors in XRP will have used this week's test and retest on the green ascending trend line to buy into XRP coins before the rally is unleashed at the beginning of 2022. With more investors adding cryptocurrencies as an asset to their portfolio, a lot of position-taking will trigger growing demand overall and see a solid bullish reaction with XRP breaking above the 55-day and the 200-day SMA retesting the red descending trend line around $1.0. Once broken above, expect markets to perceive this as any downforces to be broken and see an accelerated move towards $1.36, holding 65% of gains.
XRP/USD daily chart
Should some headwinds start to pop up at the start of 2022, for example, with the geopolitical tensions turning into a possible war between Russia and the US over Ukraine in case the talks at the beginning of January fail, expect a massive move into safe havens with cryptocurrency positions as first to be cut short. In that case, the green ascending trend line would break and test $0.60 as the first base. In case of very serious escalations of tensions and global markets sharply on the back foot, even a $0.30 would not be impossible.
Author

Filip Lagaart
FXStreet
Filip Lagaart is a former sales/trader with over 15 years of financial markets expertise under its belt.


