Ripple Technical Analysis: XRP/USD lowest level hit since December 2017, strong bearish indicators form, evening star candlestick followed by three black crows
- Ripple is dealing with heavy selling pressure on Monday, as price drops 3% in the early part of trading.
- XRP/USD drops to lowest levels seen since December 2017, as bears drive price lower.
- Bearish evening star candlestick seen on 60-minute chart, followed by the three black crows.

XRP/USD 60-minute chart
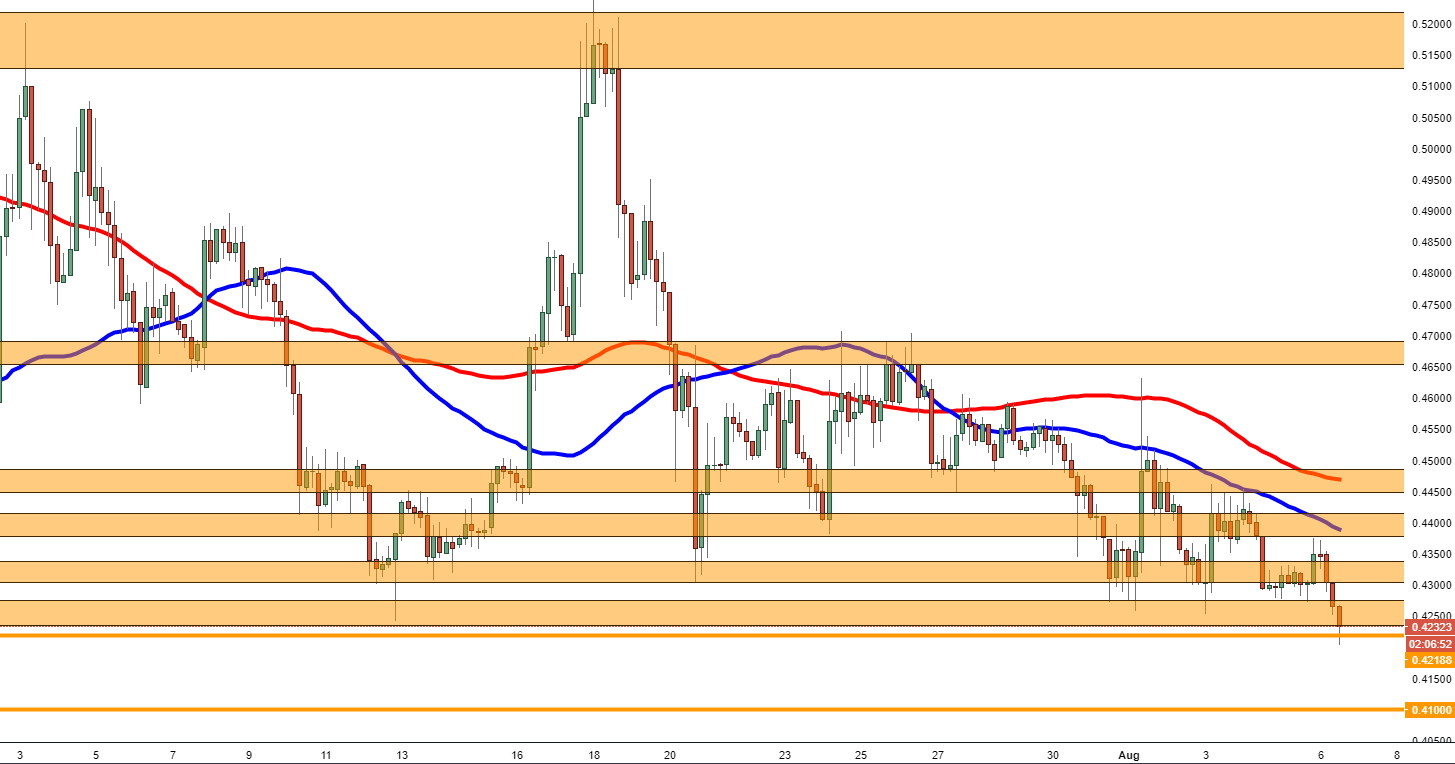
Spot rate: 0.42248
Relative change: -2.95%
High: 0.43707
Low: 0.42025
Trend: Bearish
Support 1: 0.42188, 22nd December low, long wick.
Support 2: 0.41000, 13th December, long wick.
Support 3: 0.35160, 13th December low, long wick.
Resistance 1: 0.43000, prior demand zone.
Resistance 2: 0.43850, 50MA.
Resistance 3: 0.44660, 100MA and supply zone.
Author

Ken Chigbo
Independent Analyst
Ken has over 8 years exposure to the financial markets. He started his career as an analyst, covering a variety of asset classes; forex, fixed income, commodities and equities.
More from Ken Chigbo


