|

Ripple Technical Analysis: XRP/USD double top forces bulls to hand over some gains

  • Ripple's XRP is trading within gains of over 2% into the second half of the session
  • XRP/USD produced a double top formation, bulls running into a minor near-term resistance, forced to give up some gains. 
  • there is a near-term supporting ascending trend line, providing some comfort near-term. 

XRP/USD 15-minute chart
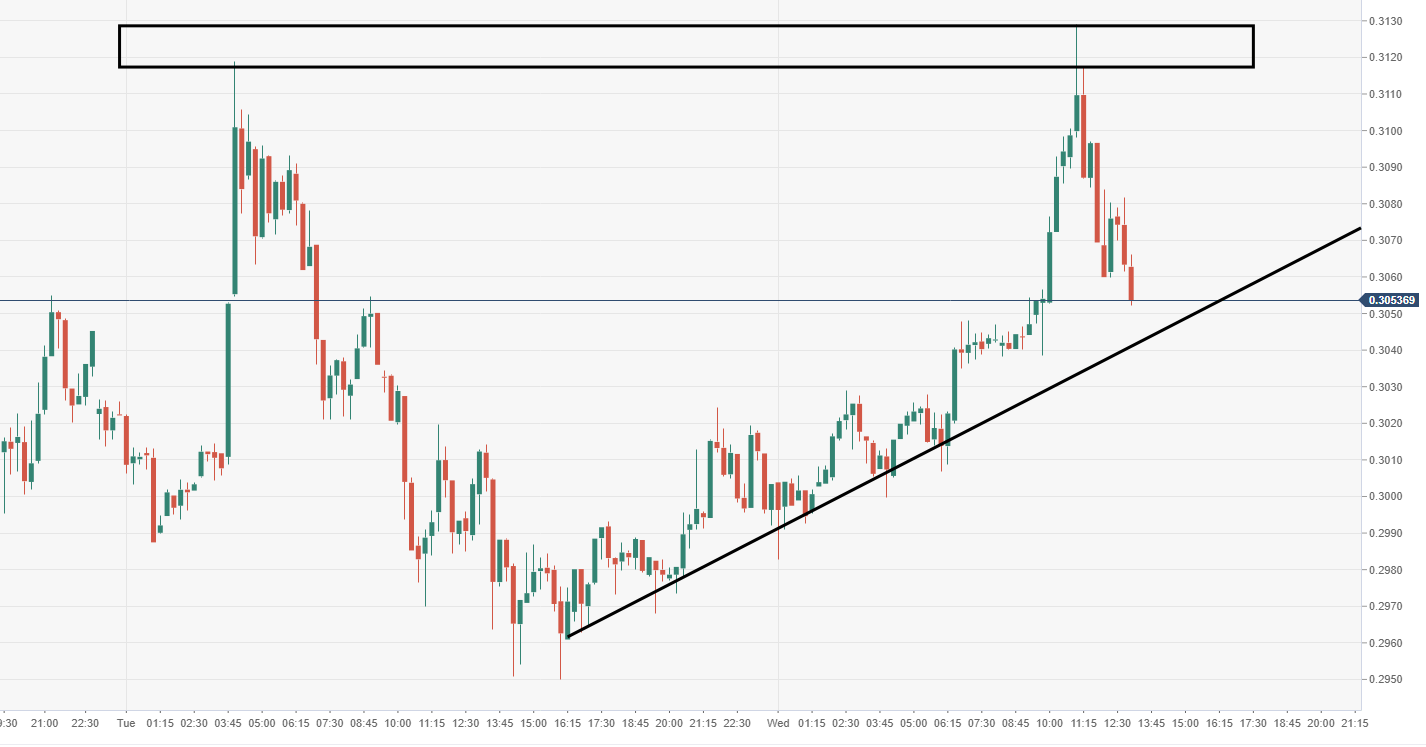


Spot rate:                  0.3058

Relative change:      +2.35%

High:                         0.3129

Low:                          0.2982

Trend:                        Bearish

Support 1:                  0.3041, ascending trend line. 

Support 2:                  0.2929, daily pivot point support.

Support 3:                  0.2855, daily pivot point support.

Resistance 1:             0.3098, upper part of channel.

Resistance 2:             0.3193, daily pivot point resistance.

Resistance 3:             0.3267, daily pivot point resistance.

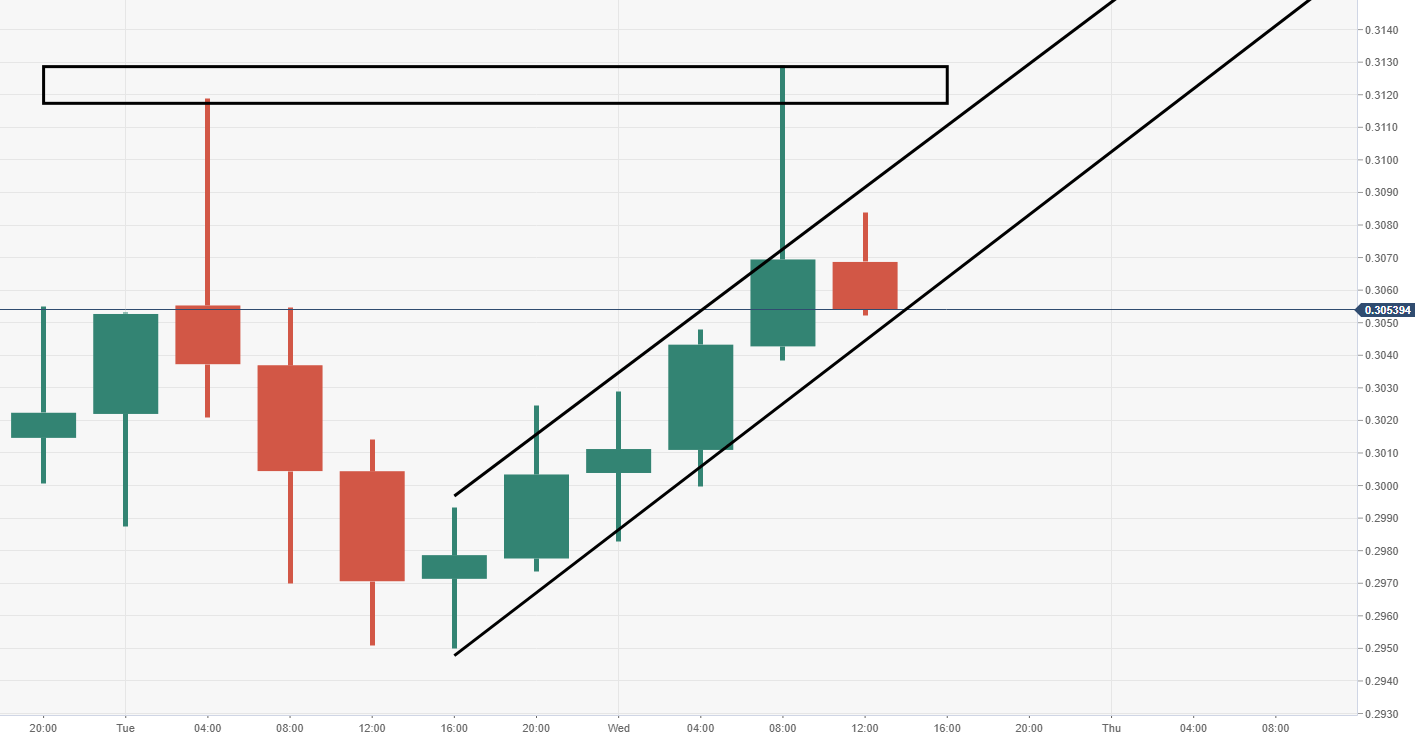
XRP/USD 4-hour chart

  • Price is somewhat support within an ascending channel formation, knocked back marginally after entering supply zone. 
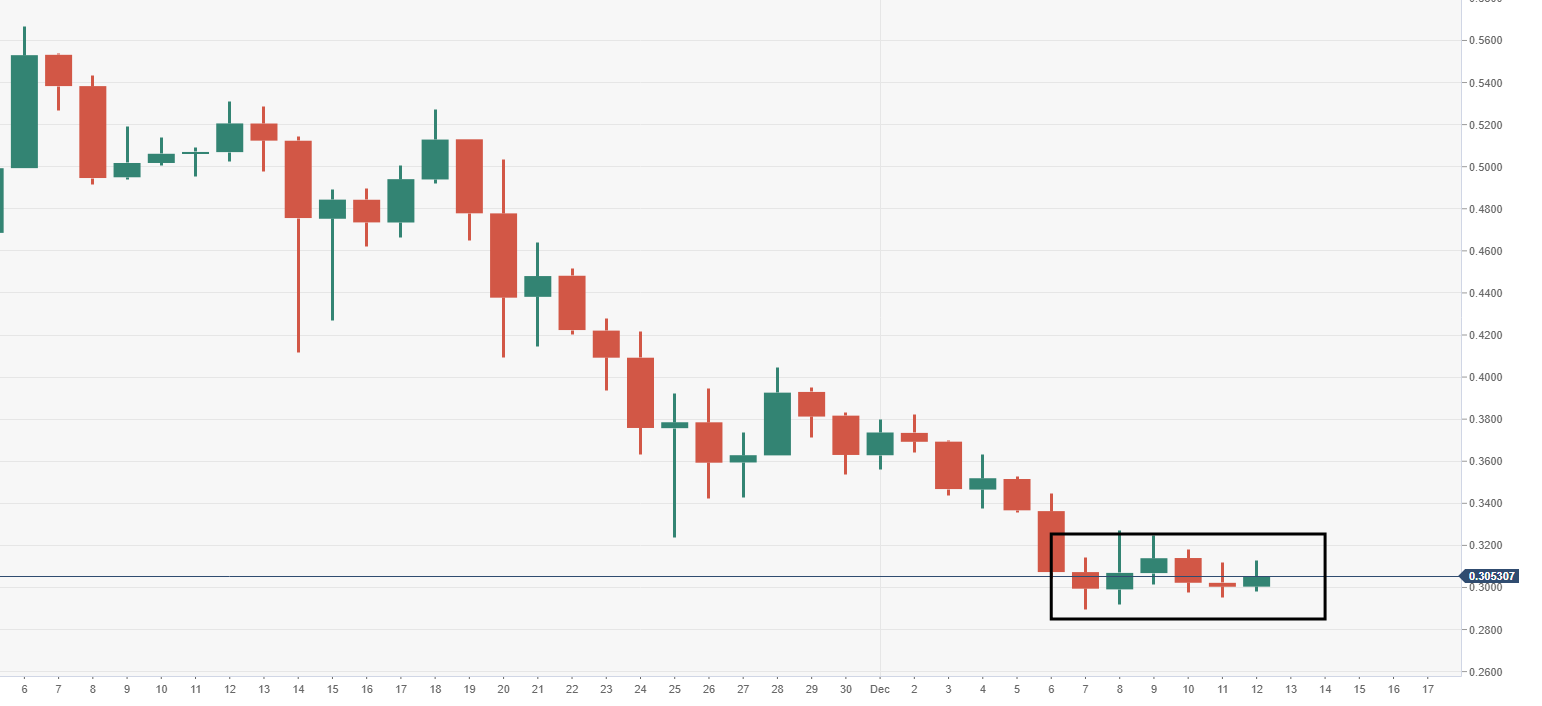
XRP/USD daily chart

  • The daily view just shows how little the price has done over the past six sessions.

Author

Ken Chigbo

Ken Chigbo

Independent Analyst

Ken has over 8 years exposure to the financial markets. He started his career as an analyst, covering a variety of asset classes; forex, fixed income, commodities and equities.

More from Ken Chigbo
Share:

Editor's Picks

Ripple bulls defend key support amid waning retail demand and ETF inflows

XRP ticks up above $1.40 support, but waning retail demand suggests caution. XRP attracts $4 million in spot ETF inflows on Thursday, signaling renewed institutional investor interest.

Crypto Today: Bitcoin, Ethereum, XRP rebound as risk appetite improves

Bitcoin rises marginally, nearing the immediate resistance of $68,000 at the time of writing on Friday. Major altcoins, including Ethereum and Ripple, hold key support levels as bulls aim to maintain marginal intraday gains.

Bitcoin Weekly Forecast: No recovery in sight 

Bitcoin price continues to trade sideways between $65,729 and $71,746, extending its consolidation since February 7. US-spot ETFs record an outflow of $403.90 million through Thursday, pointing to the fifth consecutive week of withdrawals.

Pi Network Price Forecast: PI recovery stalls amid profit-taking

Pi Network tests 50-day EMA support on Friday, after a 5% decline the previous day. PiScan data shows large deposits on CEXs totaling over 4 million PI tokens in the last 24 hours, reflecting an exodus of investors taking profits.

Bitcoin Price Annual Forecast: BTC holds long-term bullish structure heading into 2026

Bitcoin (BTC) is wrapping up 2025 as one of its most eventful years, defined by unprecedented institutional participation, major regulatory developments, and extreme price volatility.

Bitcoin: No recovery in sight

Bitcoin (BTC) price continues to trade within a range-bound zone, hovering around $67,000 at the time of writing on Friday, and falling slightly so far this week, with no signs of recovery.