Ripple Price (XRP/USD): 60-minute Technical Set Up
- The Ripple price is seen down around 1.5% in the session on Monday, as pressure remain weighted to the downside.
- 60-minute chart view remains bearish, with key area being tested.
- XRP/USD dipping in and out of vital demand area, a breach will likely open the door to a new wave of selling.

XRP/USD 60-minute chart
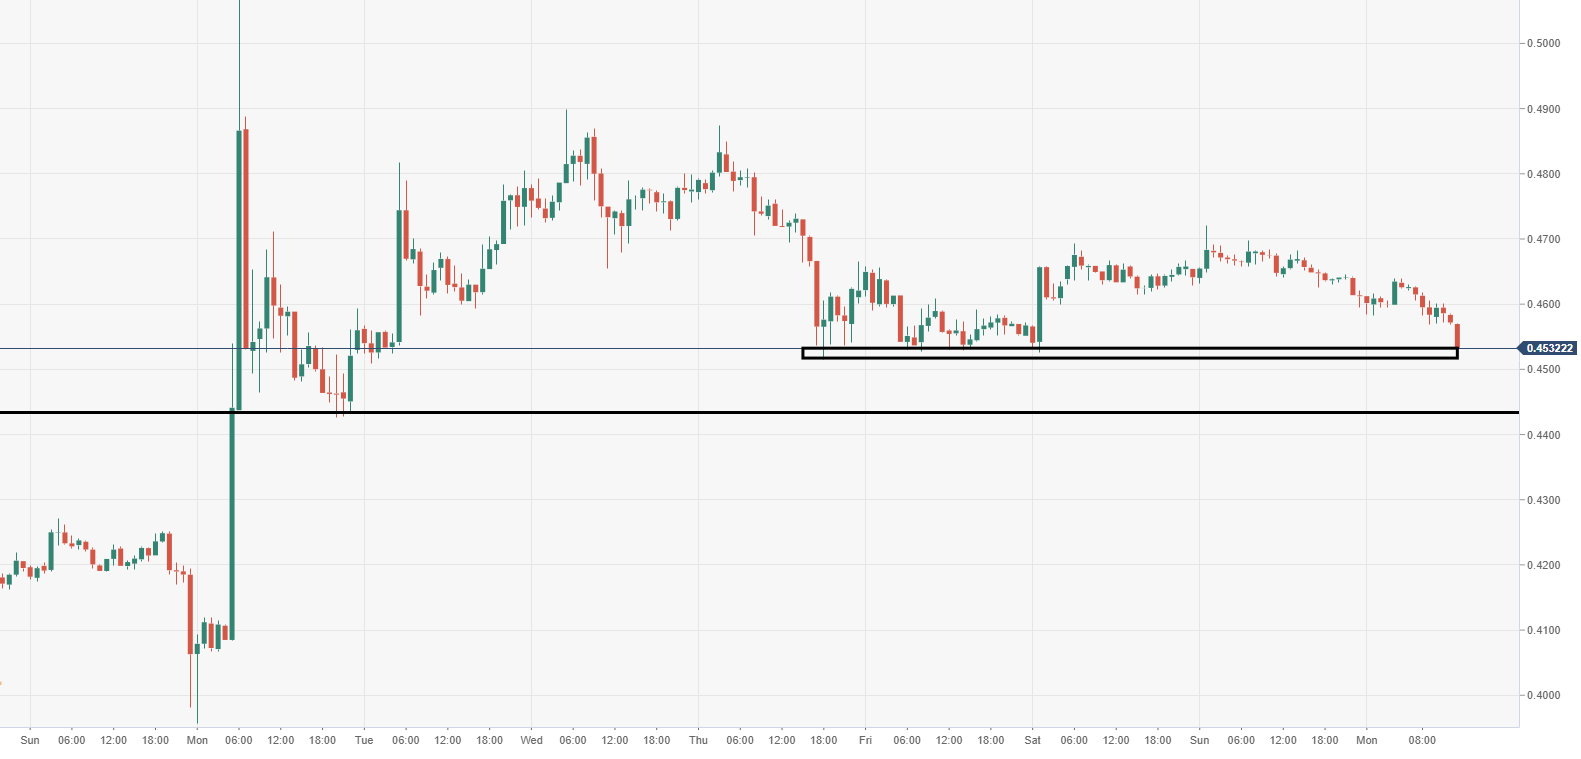
Spot rate:
Relative change: -1.50%
High: 0.46397
Low: 0.45353
Trend: Bearish
Support 1: 0.45330, support on 60-minute chart.
Support 2: 0.45250, demand zone.
Support 3: 0.44350, 15th October low area.
Resistance 1: 0.45800, resistance on 60-minute.
Resistance 2: 0.46500, supply zone.
Resistance 3: 0.47200, 21st September high.
Author

Ken Chigbo
Independent Analyst
Ken has over 8 years exposure to the financial markets. He started his career as an analyst, covering a variety of asset classes; forex, fixed income, commodities and equities.
More from Ken Chigbo


