Ripple price analysis: A quick look at all the timeframes suggests this correction isn't over
- Breakdwons and resistances visible on all the intra day time frames.
- XRP has some more pain before it stabilises.

Ripple price, after a breakdown this week is showing a pattern that won't please bulls - breakdowns and reistances abound on almost all intra day timeframes, sign that short term pain for this crypto isn't yet over and it needs time before it stabilises.
XRP/USD down more than 1 percent at $0.675 and range for the day has been very low within the 5 percent range, the only solace for the investors as its a first sign of stability. Only remains to be seen is if this low volatility extends to Monday when most of the traders and investors come online after a weekend holiday.
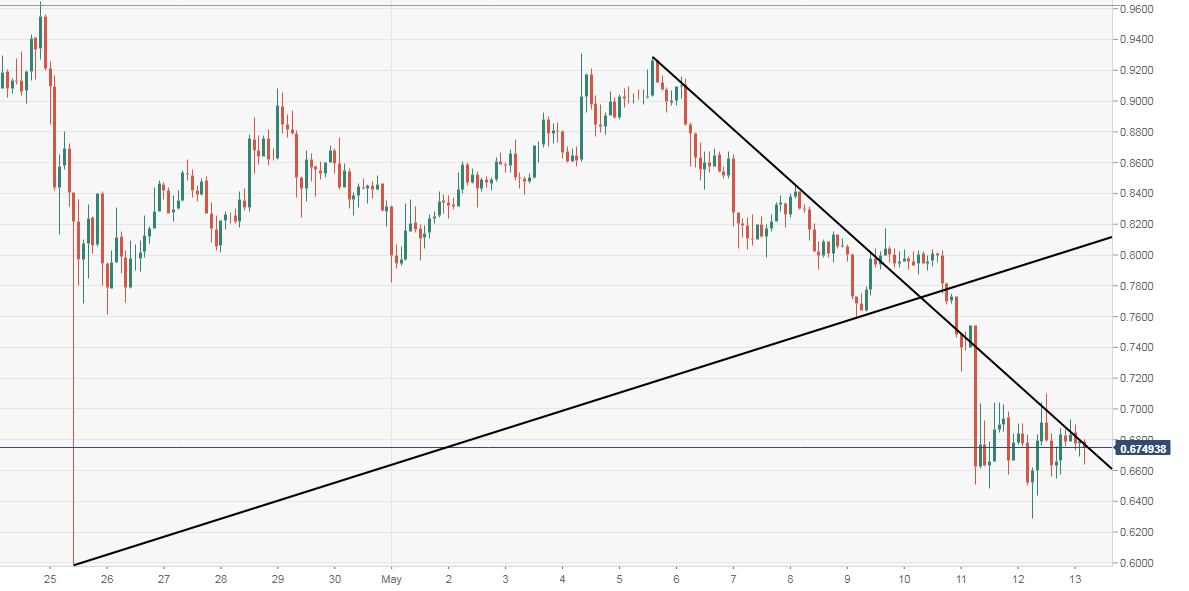
On the 120-minute chart, after breakdown, Ripple consistently has been trading below the resistance line and the bears will continue to have a field day as long as it remains below it, which is placed at $0.677 exactly where the price is currently.
XRP/USD 120-minute chart:
Author

Manoj B Rawal
Independent Analyst
Manoj B Rawal, financial markets professional with about 11 years of experience in writing, editing and advising on stocks, currencies and fixed income.


