Ripple and MoneyGram part ways amid weakening technical levels
- Increase overhead pressure at $0.5 leaves near-term support at the 38.2% Fibonacci level vulnerable.
- The MACD on the 4-hour chart shows that recovery will continue to delay amid potential sideways trading.
- The 50 SMA and the 100 SMA will absorb the selling pressure if declines increase intensity toward $0.4.

Ripple’s Chief Executive Officer, Brad Garlinghouse, confirmed that the company has wound up collaborating with MoneyGram in an unexpected twist of events. According to a statement released by Ripple, the two firms mutually agreed to end the prevailing agreement.
Ripple and MoneyGram could revisit the partnership in the future
The partnership between Ripple and MoneyGram was a game-changer in the cryptocurrency industry. It emphasized how cryptocurrency can be used to impact the daily life of everyone across the board.
Ripple reckons that it is happy with the achievements it has made with MoneyGram, especially with RippleNet and On-Demand Liquidity (ODL). Several payment corridors benefited from these products. Besides, the cross-border company recorded a massive increase in ODL volume following the partnership. Ripple added that it is not the end of the road for partnership, which may be reviewed in the future.
We are both committed to revisiting our relationship in the future. We still believe in the promise of digital assets and blockchain technology to change the status quo in global payments for the benefit of billions of consumers around the world.
Ripple recovery stalls under $0.5
Ripple’s rebound from the drop to $0.35 in February has not achieved as much as investors expected. Resistance at $0.5 is a hard nut to crack; moreover, more seller congestion has been witnessed at the 200 Simple Moving Average (SMA).
Meanwhile, XRP is seeking refuge at the 38.2% Fibonacci level while trading at $0.479. Losing this support will increase instability in Ripple’s market and perhaps lead to losses back to $0.4. Several support areas are projected to anchor the price, including the 100 SMA and the 50 SMA on the 4-hour chart.
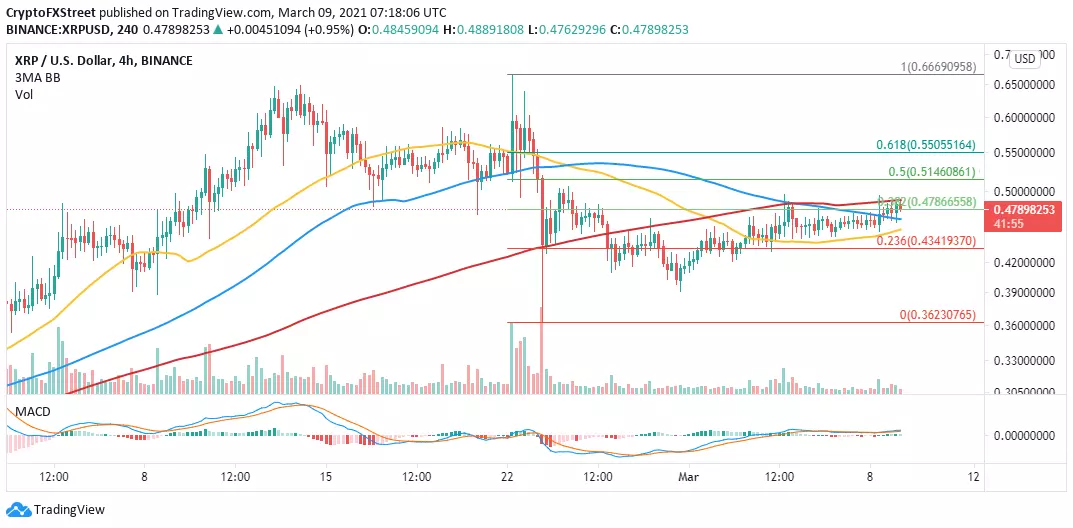
XRP/USD 4-hour chart
The Moving Average Convergence Divergence (MACD) has a slight bullish bias but not strong enough to support a rebound. In other words, it shows that Ripple may settle for sideways price action, particularly if the Fibo 38.2% support holds.
Looking at the other side of the fence
Overhead pressure at $0.5 is the only hindrance to XRP achieving the recovery goals. Therefore, buyers must focus on pushing this zone in the rearview. That way, they will be allowed to pay attention to higher price levels, preferably $0.65 and $0.75.
Author

John Isige
FXStreet
John Isige is a seasoned cryptocurrency journalist and markets analyst committed to delivering high-quality, actionable insights tailored to traders, investors, and crypto enthusiasts. He enjoys deep dives into emerging Web3 tren


