Powerful reversal pattern will launch Dogecoin to $0.43
- Dogecoin price looks for a reversal and massive drive higher.
- Inverse head-and-shoulders pattern at the bottom of a swing often triggers explosive movement higher.
- Point and Figure charts clear up a lot of the consolidation and noise associated with candlestick charts, providing more clear price action structure.

Dogecoin price is ready for a strong rebound as pent-up demand and a return of bulls come into the market. However, a powerful reversal pattern is present and could trigger one of the most explosive moves higher that Dogecoin has seen in the past six months.
Dogecoin inverse head-and-shoulder setup could generate a 100% gain
Dogecoin price has one of the most sought-after bullish reversal patterns in technical analysis: the inverse head-and-shoulder pattern. The strength of this pattern is exacerbated by the location of its development: the bottom of swing low. As a result, bulls will need to push Dogecoin to a close above the neckline at $0.27, but from there, sustained price action is likely to continue.
Utilizing the Fibonacci expansion tool projects a target zone of $0.43. The horizontal profit method in Point and Figure analysis points to $0.42 and compliments the Fibonacci expansion zone. Thus, there is little resistance to stop Dogecoin price from gaining nearly 100% on the next breakout. Some profit-taking may occur at the 161.8% Fibonacci expansion at $0.35, but the pent-up demand and momentum accompanying Dogecoin may make $0.35 a moot price level.
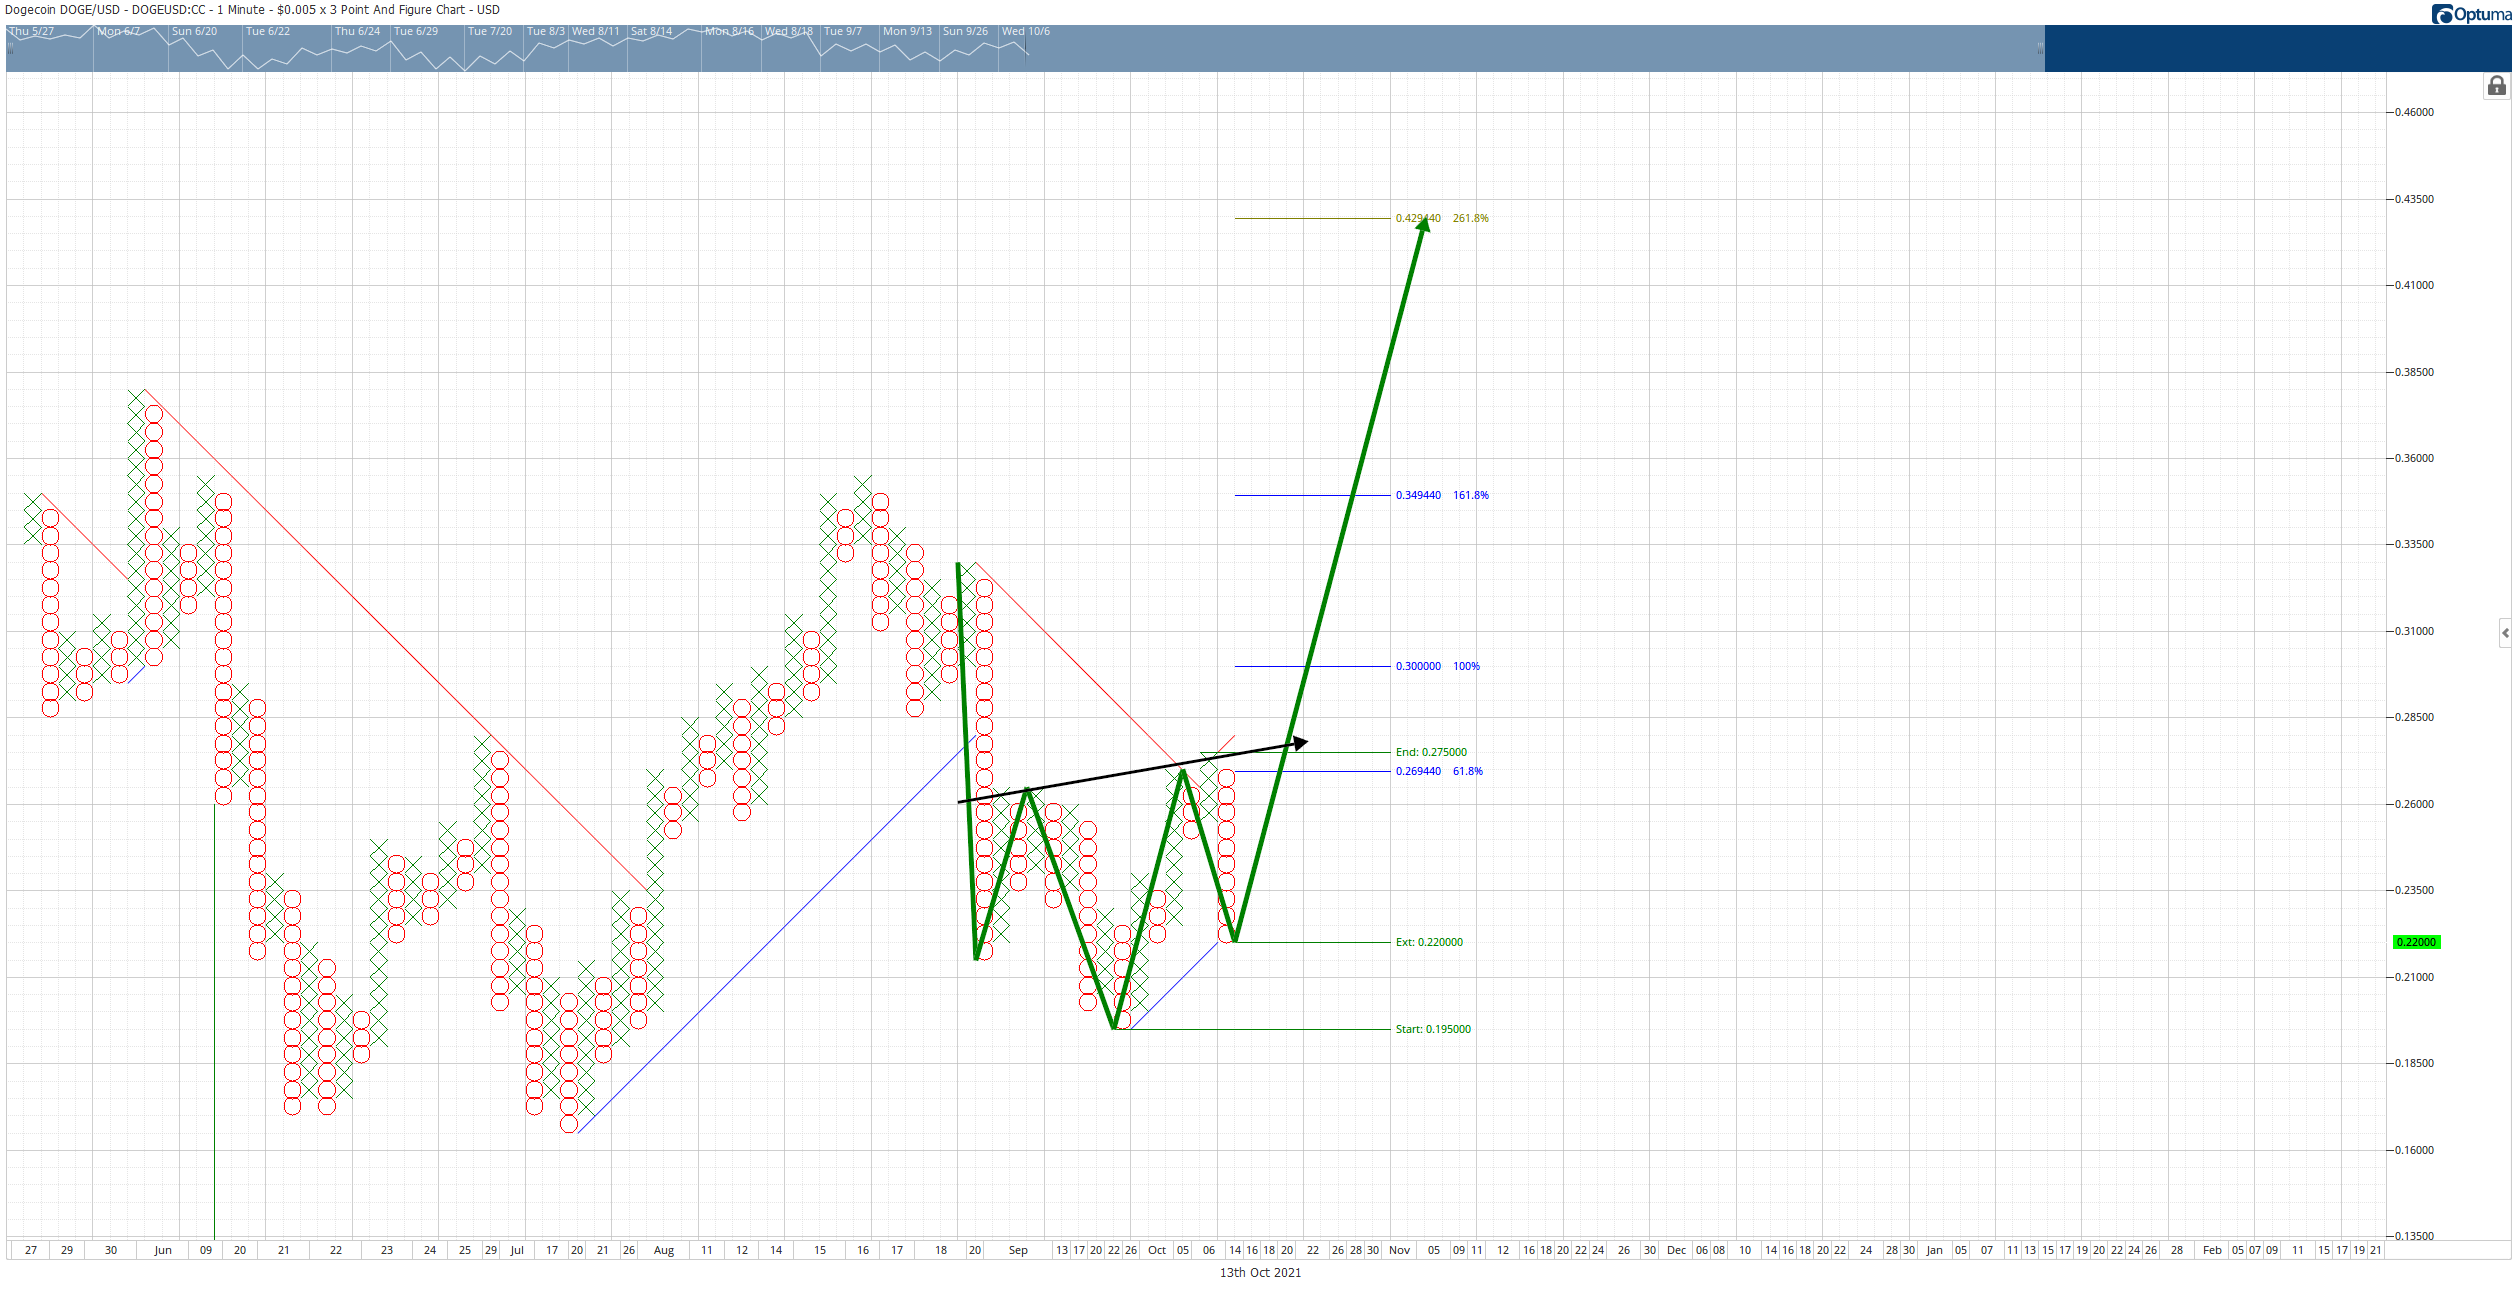
This bullish outlook can be invalid by breaching below the head of the inverse head-and-shoulder pattern at $0.195. A break below that level will likely generate strong selling that could target a high volume node at the $0.13 value area. Below that, it’s a quick trip to $0.08.
Author

Jonathan Morgan
Independent Analyst
Jonathan has been working as an Independent future, forex, and cryptocurrency trader and analyst for 8 years. He also has been writing for the past 5 years.