Polkadot Price Prediction: One more flash crash to $5.30
- Polkadot price is shown significant bearish signals during the final trading week of October.
- DOT shows an influx of volume throughout the downtrend.
- Invalidation of the bearish thesis is a breach above $6.27.

Polkadot price could be setting up for an 8-10% decline; key levels have been identified,
Polkadot price is underwater
Polkadot price might be setting up for a flash crash scenario. For the month, the DOT price is down 8%. However, the bears seem to be developing momentum as large bearish engulfing candlesticks accompanied by upticks in the volume are noticed within each declining rally.
Polkadot price currently auctions at $5.88 as the bulls have been recently rejected near the 8-day moving average after a weekend. As a result of the rejection, the first candle is a bearish engulfing candle resembling price action in previous declines. Additionally, the rejection was the first response for the DOT price after climbing out of the oversold territory
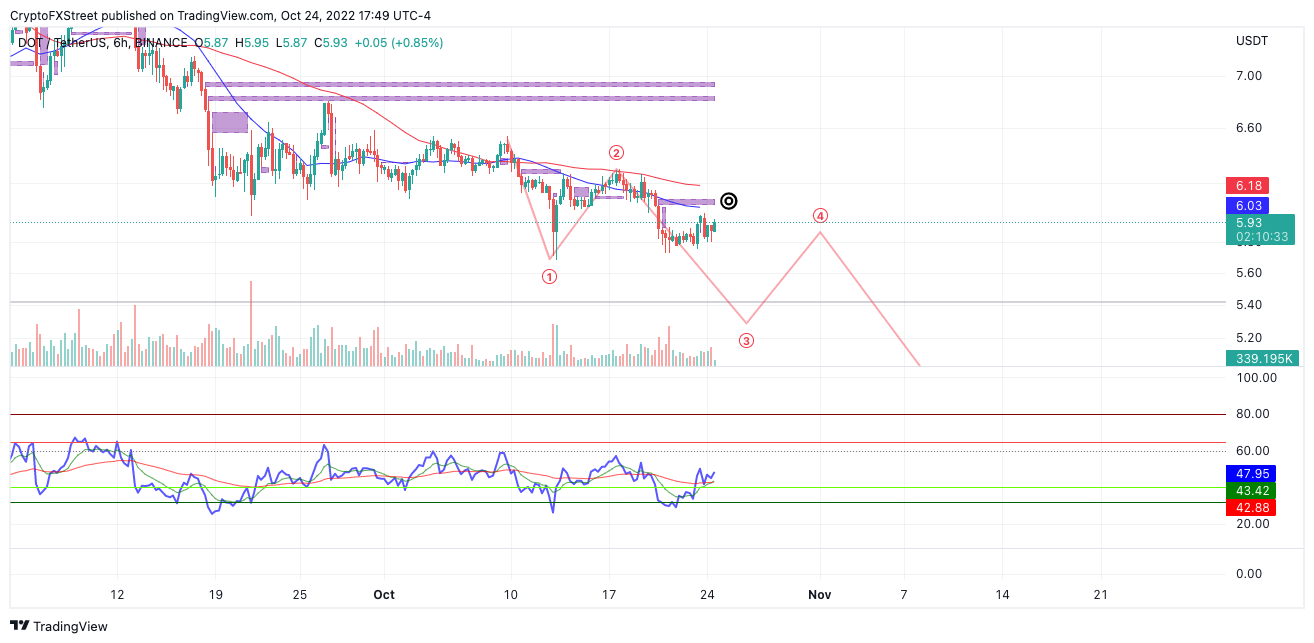
DOTUSDT 6-Hour Chart
Based on the technicals, the DOT price has space to climb, but traders should be very cautious. A second attempt at the $5.70 low should not be considered a buy-the-dip opportunity. A breach of the lows could induce a flash crash towards the $5.30 liquidty zones resulting in a further 10% decline.
Invalidation of the bearish thesis can occur if the bulls reconquer the$ 6.40 swing high produced on October 17. An additional rally towards $7.00 could occur if the breach occurs, resulting in an 18% increase from the current Polkadot price.
In the following video, our analysts deep dive into the price action of Polkadot, analyzing key levels of interest in the market. -FXStreet Team
Author

Tony M.
FXStreet Contributor
Tony Montpeirous began investing in cryptocurrencies in 2017. His trading style incorporates Elliot Wave, Auction Market Theory, Fibonacci and price action as the cornerstone of his technical analysis.



