Polkadot Price Forecast: DOT edges closer to a 35% upswing from a broadening wedge pattern
- Polkadot price is consolidating in a broadening wedge pattern suggesting a bullish breakout shortly.
- A successful breach of this setup indicates a 35% surge to record levels at $50.
- DOT’s on-chain metrics show considerable growth adding credence to its bullish outlook.

Polkadot price has recovered from the selling frenzy and is climbing higher in hopes of establishing a new uptrend. The consolidation since the DeFi token’s all-time high at $42.39 has resulted in a descending broadening wedge pattern.
Polkadot price poised for a new all-time high
Polkadot price has been on a decline since February 20, forming lower highs and lower lows. Joining these swing highs and swing lows with trendline results in a descending broadening wedge pattern.
This technical setup forecasts a 35% upswing, determined by measuring the distance between the pivot high and the latest swing low and adding it to the breakout point at $36.40.
This target puts DOT at $50, a new all-time high.
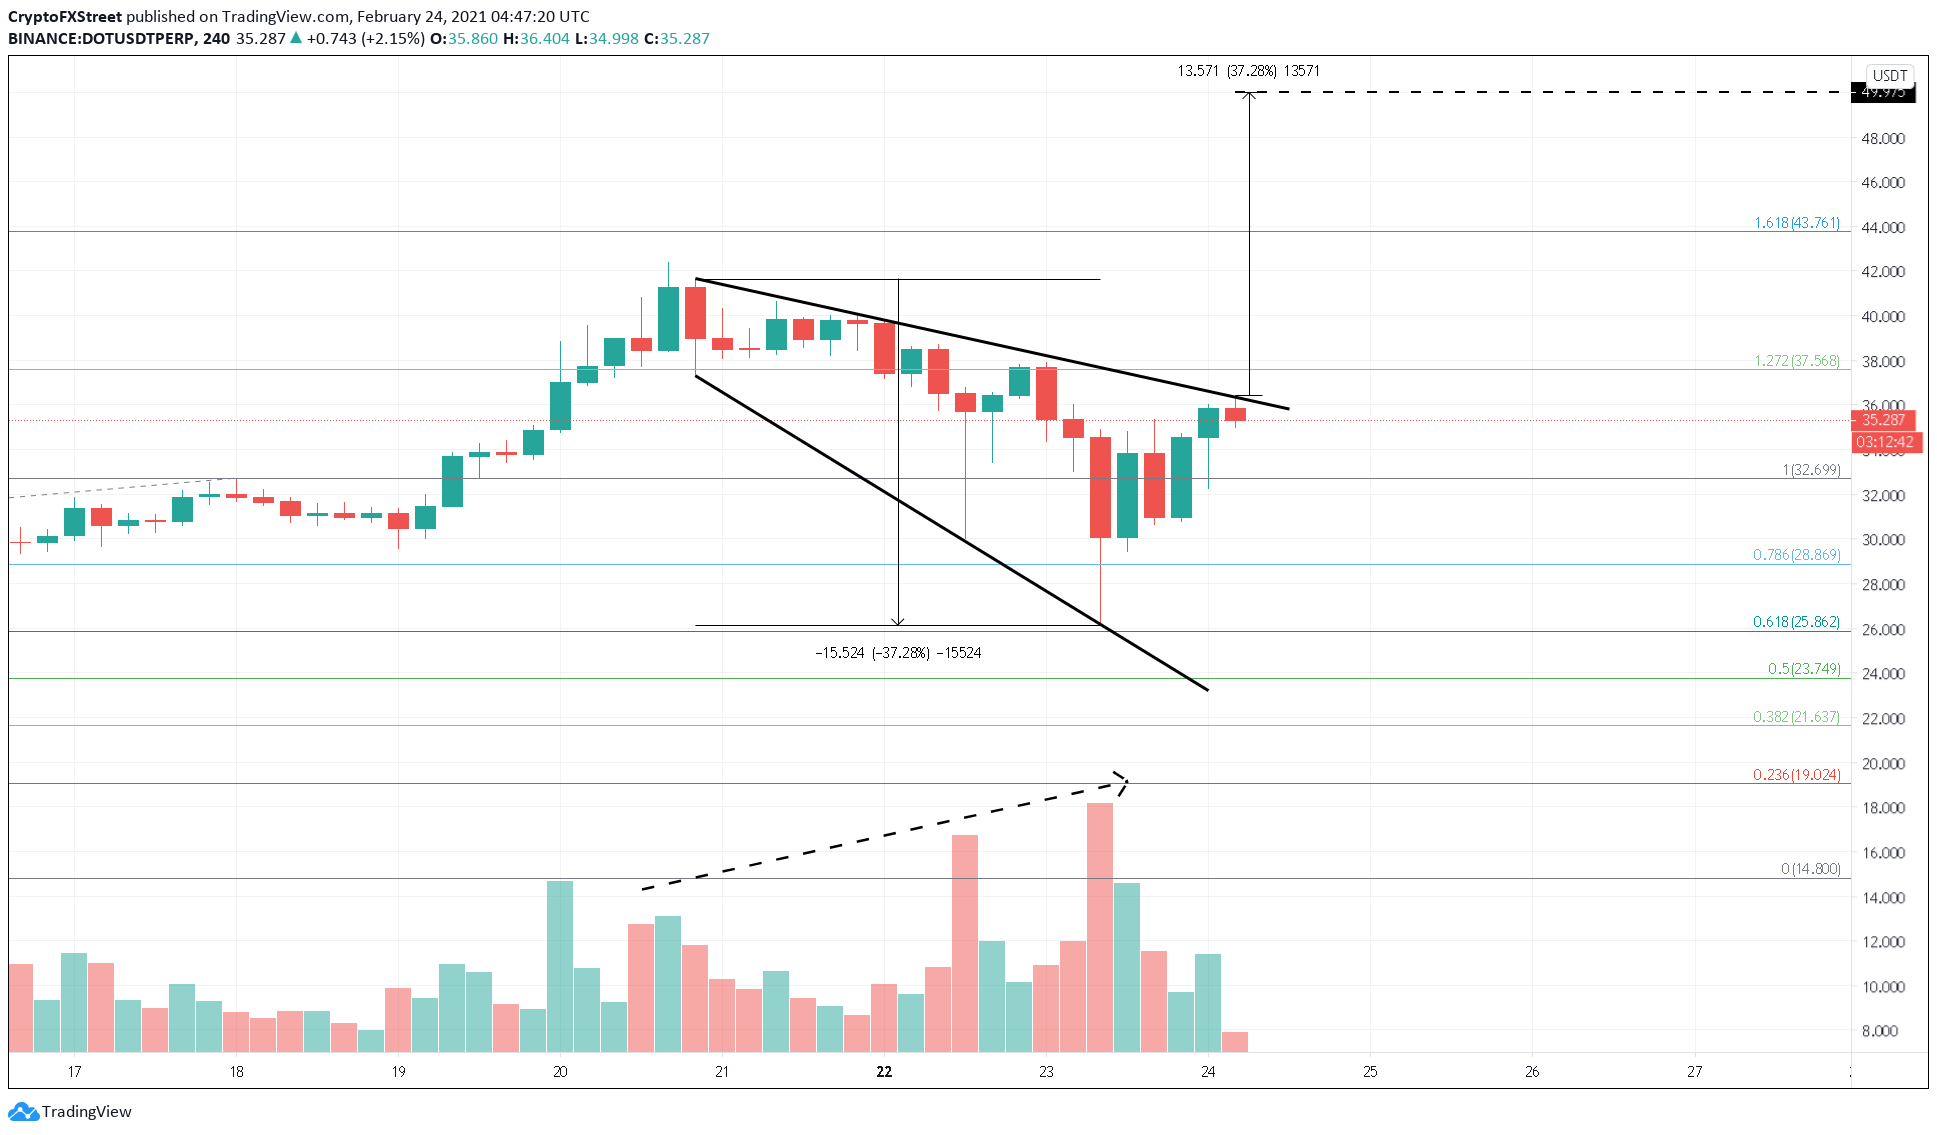
DOT/USDT 4-hour chart
Adding credence to this bullish scenario is Polkadot’s 125% increase in on-chain volume from $3.26 billion to $7.35 billion between February 22 and 24.
Moreover, a 33% drop in social volume in the same period is also incredibly positive from a counter-sentiment perspective.
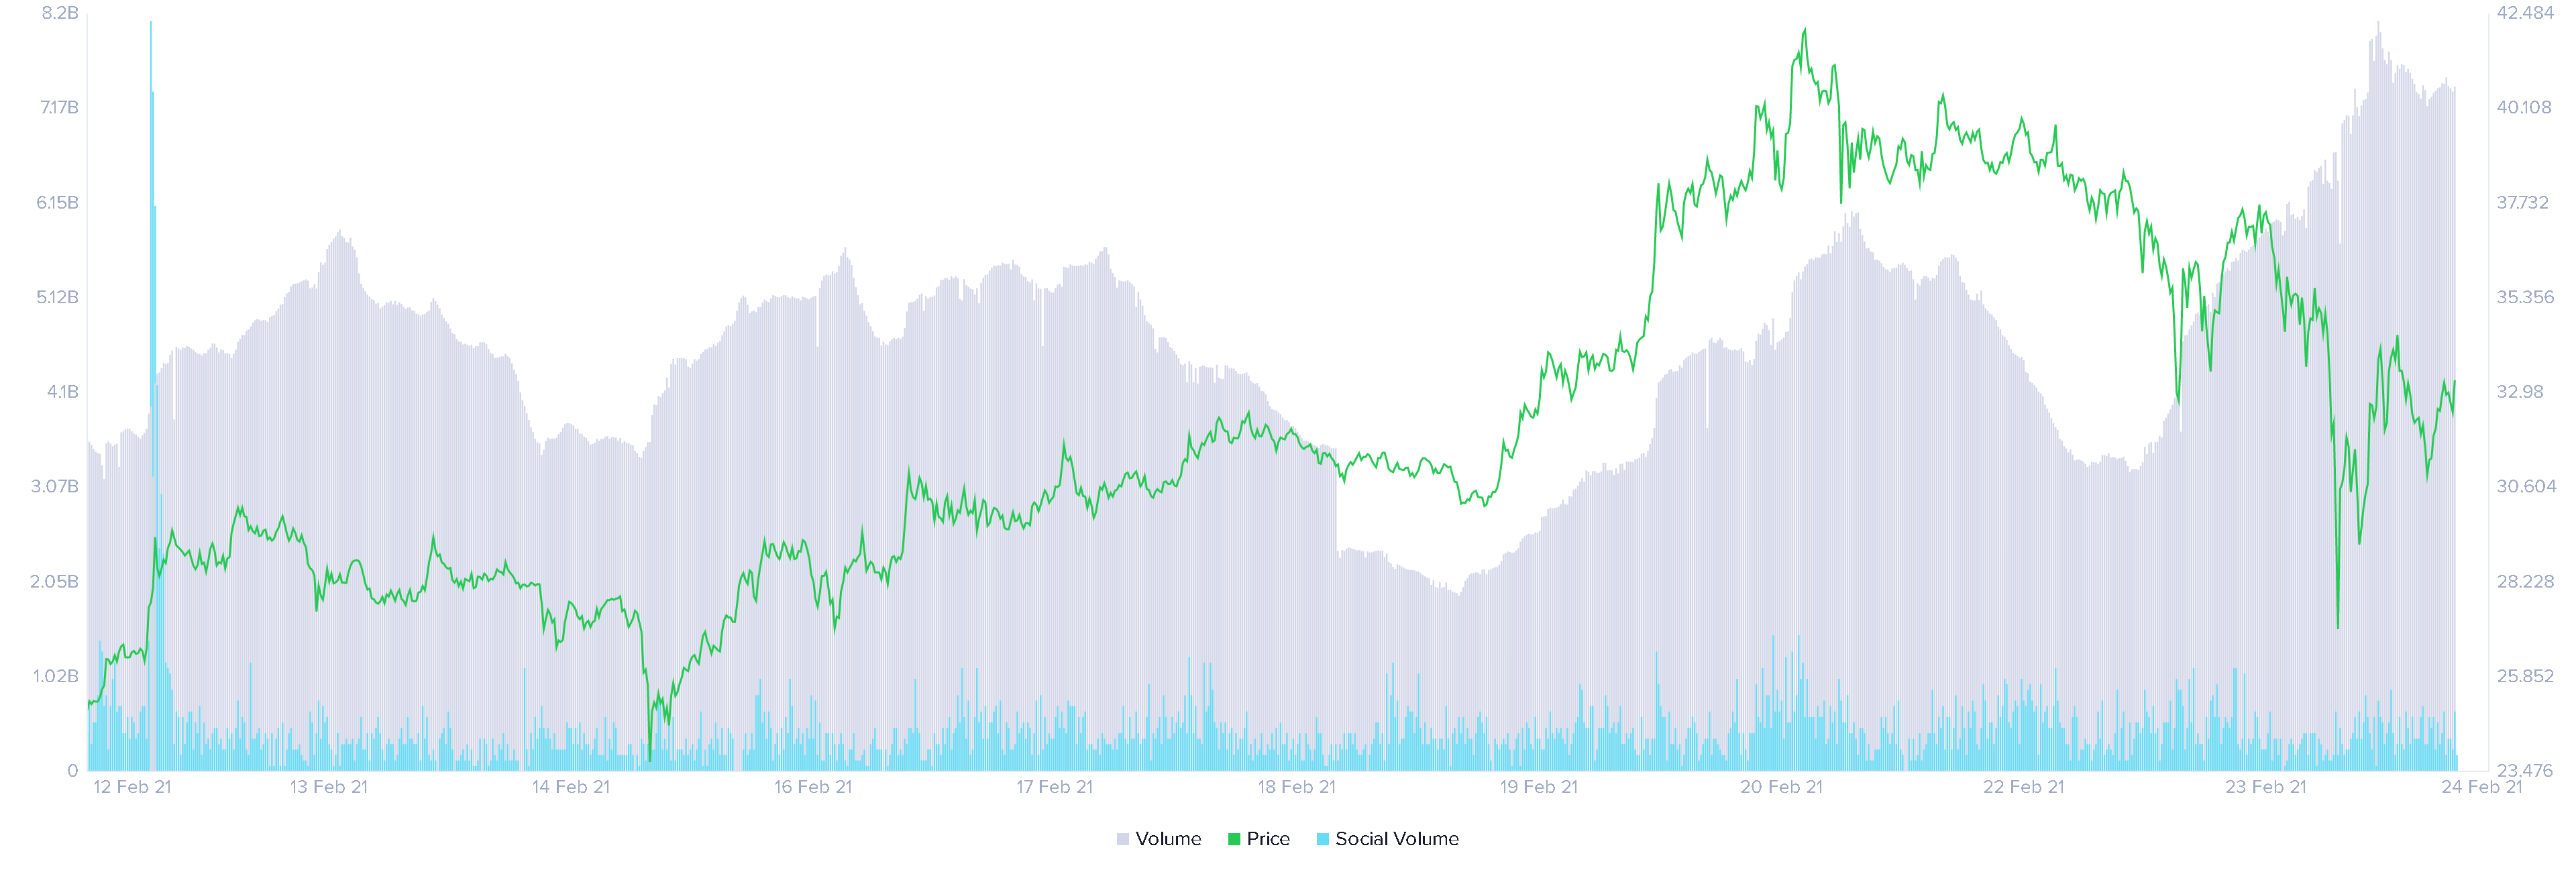
Polkadot on-chain and social volume chart
A similar uptrend can be witnessed with the developer activity index, which has swelled from 3.69 to 4.33 within the same time. Market participants consider this surge a bullish sign since a high developer activity suggests a possibility of the project’s new update or a developmental rollout.
Interestingly, DOT price has dropped 13% while these on-chain metrics saw substantial growth, thus creating a bullish divergence.
These developments indicate Polkadot’s inevitable breakout from the consolidation pattern. In such a case, a four-hour candlestick close above the 127.2% Fibonacci retracement level at $37.56 will not only signal a breakout from the wedge but also the start of an uptrend.
Increased buying pressure here could propel the DeFi token to its intended target at $50.
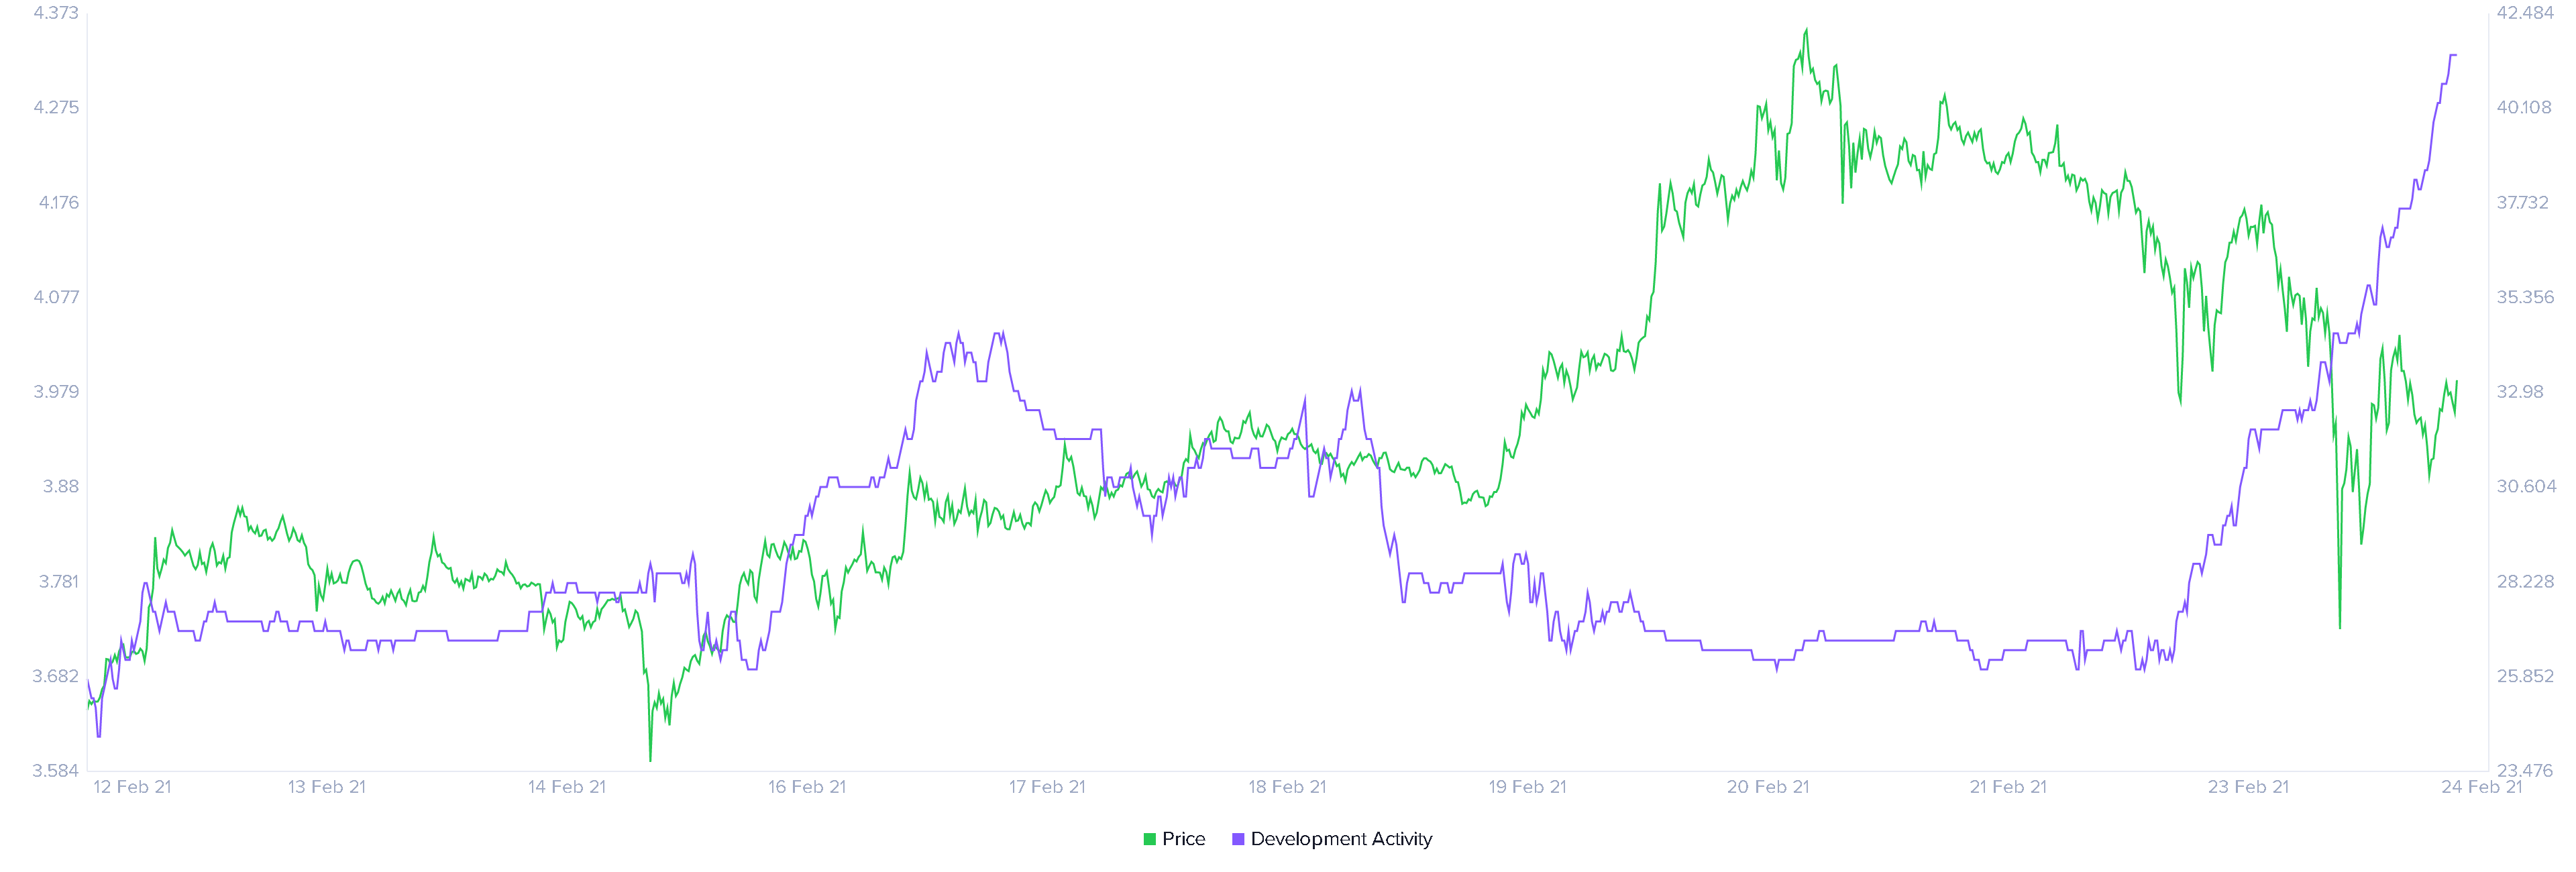
Polkadot developer activity index chart
Investors need to be aware that rejection at either $36.40 or the resistance barrier at $37.56 would be fatal. If this were to happen, DOT would re-enter the consolidation phase and slide to the 78.6% Fibonacci retracement level at $28.85.
Author

Akash Girimath
FXStreet
Akash Girimath is a Mechanical Engineer interested in the chaos of the financial markets. Trying to make sense of this convoluted yet fascinating space, he switched his engineering job to become a crypto reporter and analyst.


