Polkadot Price Prediction: DOT might see minor pullback before continuing 64% bull rally
- Polkadot price has surged nearly 10% after breaking out of a bullish pennant pattern.
- The MRI indicator’s cycle top signal could momentarily deter the upswing.
- A bearish scenario might evolve if DOT drops below $37.5.

The Polkadot price has been on a tear for more than ten days and could take a slight pause before resuming its uptrend.
Polkadot price faces momentary pause
The Polkadot price slid into consolidation after rallying 190% between January 22 and April 4. While the initial spike can be considered as a flag pole, the one that followed it can be viewed as a pennant.
DOT converged between two trend lines setting up lower highs and higher lows in the consolidation phase, creating a pennant. The technical formation is a continuation pattern and projects a 63% upswing, determined by adding the flagpole's height to the breakout point at $38.
This target places DOT at $62.44, a new all-time high.
As of April 2, the Polkadot price sliced through the pennant’s upper trend line, signaling the start of a new uptrend.
Since March 25, the DeFi token has surged nearly 57%, triggering the Momentum Reversal Indicator’s cycle top signal in the form of a red one candlestick on the daily chart. This setup forecasts a one-to-four candlestick correction.
Hence, DOT could see a minor correction unfold toward the immediate demand barrier at $42.39 before resuming its uptrend toward the intended target at $62.44.
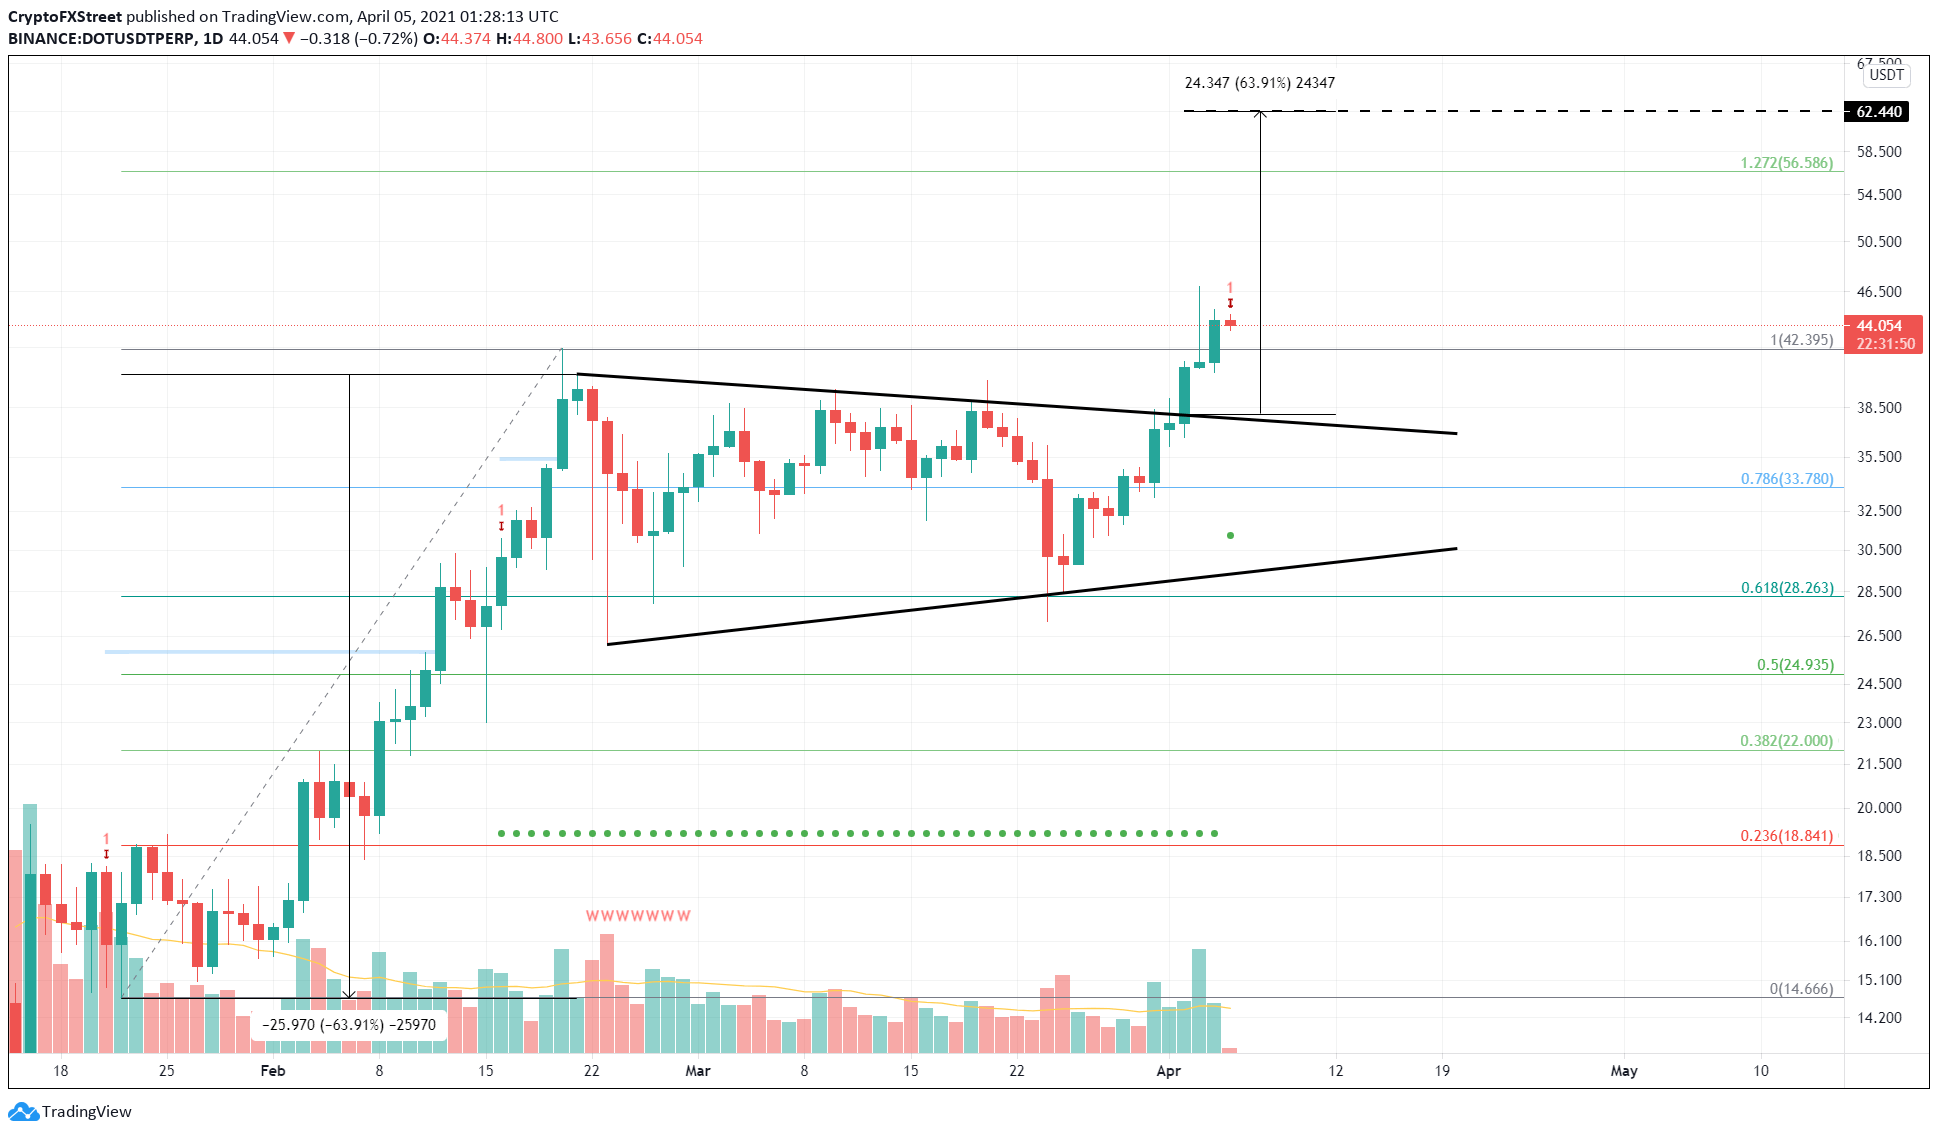
DOT/USD 1-day chart
While things seem bullish for the Polkadot price, investors need to pay close attention to the retracement. If this pullback extends beyond $37.5, it will put the bullish outlook on hold and perhaps trigger a bearish one.
In such a scenario, panicking investors might sell their holdings pushing DOT back into the pennant formation to retest the subsequent demand barrier at $33.7, which coincides with the 78.6% Fibonacci retracement level.
Author

Akash Girimath
FXStreet
Akash Girimath is a Mechanical Engineer interested in the chaos of the financial markets. Trying to make sense of this convoluted yet fascinating space, he switched his engineering job to become a crypto reporter and analyst.


