Polkadot Price Prediction: DOT eyes short-term pullback ahead of its $10-bound move
- Polkadot price faces strong opposition at the 100-day SMA.
- The TD Sequential indicator could send a sell signal that may compel DOT price to revisit its $6.00 support.
- A break above the seller congestion at $7.13 will keep Polkadot price on the path to $10.00.

Polkadot price is on the cusp of snapping out of a bullish breakout to $6.90. Apart from Binance Coin (BNB), most crypto assets are back in the red, with DOT also set to retreat further before continuing with its northbound move to $10.00.
Polkadot price bows as overhead pressure mounts
The parachain token eyed a major move to $10.00 as it rebounded from its key demand area at $6.00. However, overhead pressure started to grow as it approached $6.90. The 100-day SMA (Simple Moving Average) (in blue) added weight to this resistance zone – a situation gradually changing DOT’s technical outlook from bullish to bearish.
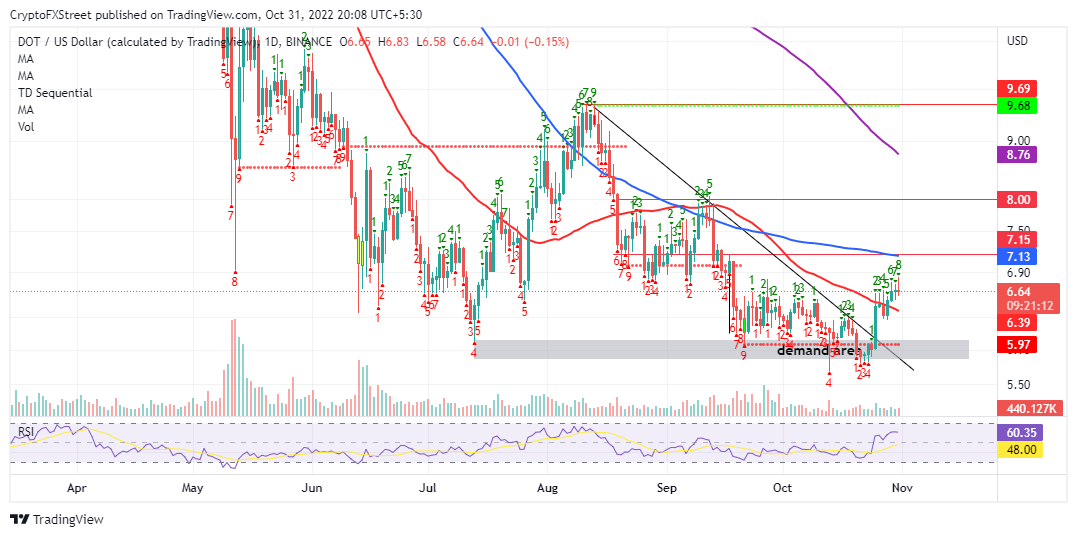
DOT/USD daily chart
Polkadot price trades at $6.63 at the time of writing while bears work around the clock to bring down the price. Short-term support is expected at the 50-day SMA (in red), but investors should be prepared to incur more losses if push comes to shove.
The TD Sequential indicator will probably send a sell signal in the coming days. The call to investors and traders to short DOT will manifest in a green nine candlestick. In addition to this green candle, traders should confirm that the high of the sixth and seventh bars in the count is exceeded by that of the eighth and ninth candles.
A bearish pattern in the shape of a rising wedge has formed on the four-hour chart, as shown below. If the DOT price slides below the pattern’s lower line, it could lead to a profitable short position with a possible exit target at $6.25.
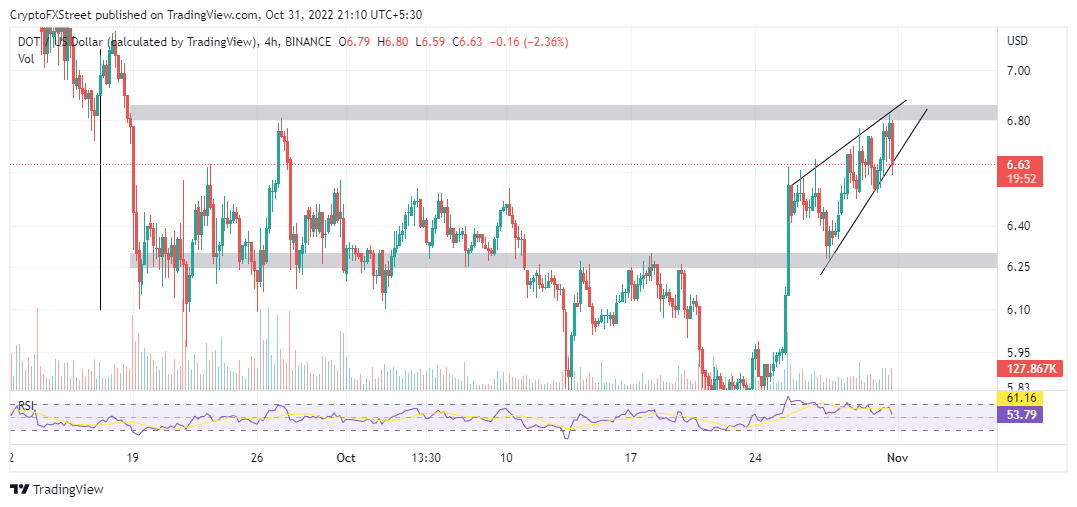
DOT/USD four-hour chart
The RSI (Relative Strength Index has retreated into the neutral region as it forms a bearish divergence with price. If its downward slope continues, Polkadot price will have no option but to stretch its next leg down. For this reason, stubbornly bearish traders could wait for the price to retest support at $6.00 before closing their sell positions.
Author

John Isige
FXStreet
John Isige is a seasoned cryptocurrency journalist and markets analyst committed to delivering high-quality, actionable insights tailored to traders, investors, and crypto enthusiasts. He enjoys deep dives into emerging Web3 tren


