• Polkadot price has fallen penny-from-Eiffel style on two separate occasions.
  • DOT price has printed three clean impulse waves and has yet to tag significant liquidity levels near the rally's origin point. 
  • A retracement can occur as high as $11.75 and still uphold a bearish outlook towards $4.00.

Polkadot price could witness one more catastrophic demise before a true crypto bull run begins.

Polkadot price could fall once more

From a midterm perspective, Polkadot's price could witness an additional 50% drop. The smart contract giant witnessed an incredible 2,400% rally since August 2020. The DOT price rallied to an all-time high at $55 before the bears took over the scene. 

Polkadot price auctions 84% below its all-time high, yet there are still reasons to believe in one more 50% plummet in the coming months. 

At the time of writing, Polkadot price trades at $8.38. The technicals mirror a fractal wave dating back to March 2022, when the DOT price rallied 70% in a month, only to fall flat and decline an additional 75%. The sell-off came in almost free-fall fashion. A significant uptick in bearish pressure was imprinted near the $11.75 price level during the first week of May. Additionally, the DOT price breached through the Relative Strength Index’s supportive level into oversold territory.

The penny-from-Eiffel style decline has happened on two separate occasions, each reducing the Polkadot price by more than 50%. Elliott Wave theory suggests that the Polkadot price has printed three clear impulse waves (or one supercycle wave) into the $55 high. A supercycle correction could be on the table with targets at the origin point of the ascension at $4.00. 

tm/dot/8/18/22

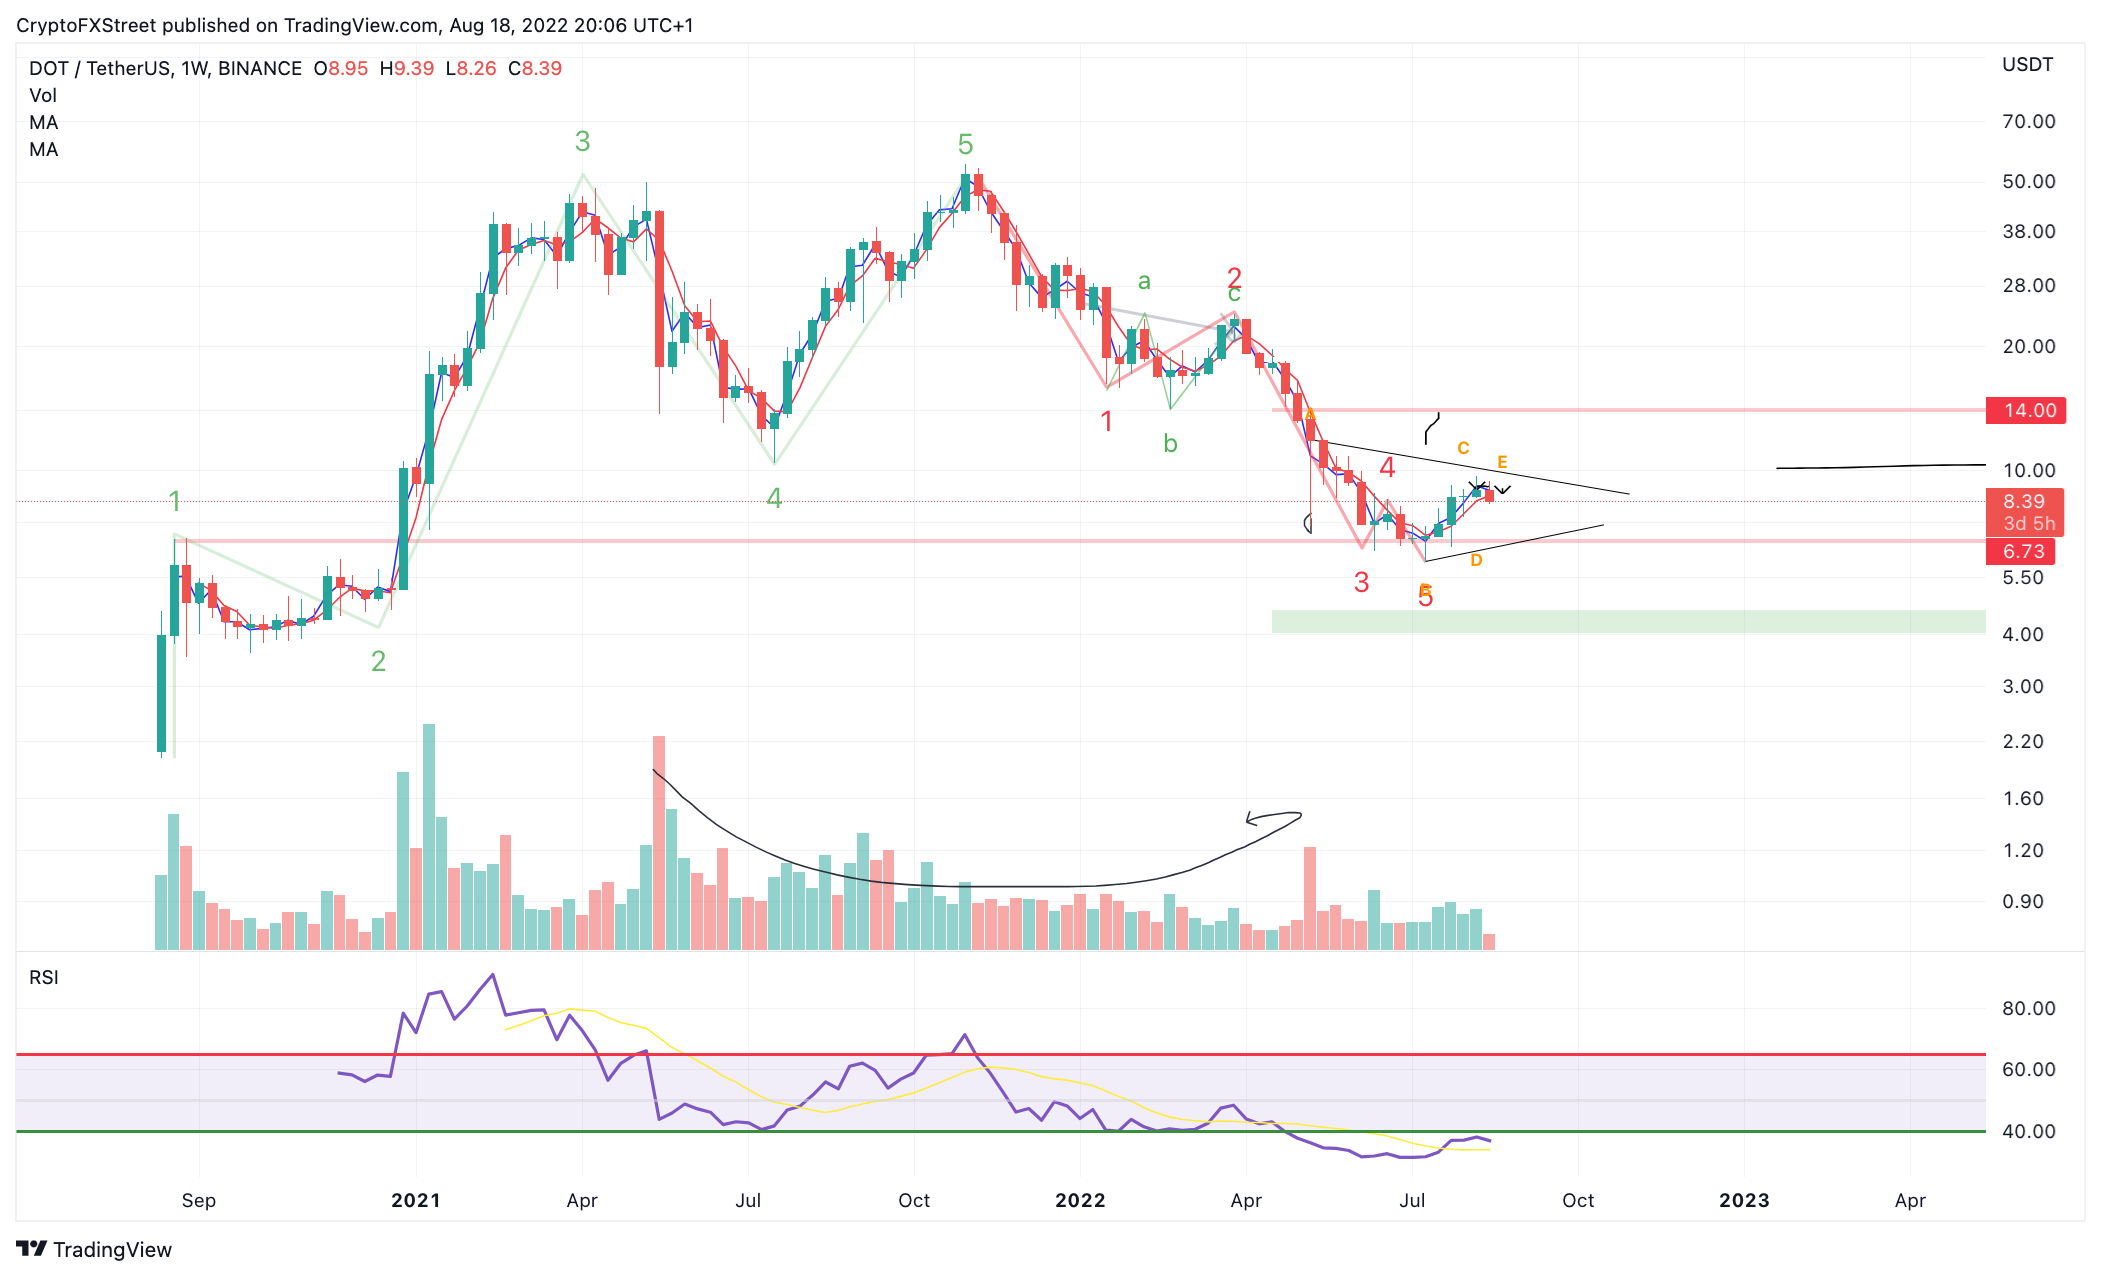
DOT/USDT 1-Weel Chart

Investors should be very careful as DOT price can rally towards $11.74 without invalidating the bearish midterm thesis. If the technicals continue to unfold in what appears to be a triangular fashion, then a sell-off into the $4.00 price zone could occur as early as 2023

In the following video, our analysts deep dive into the price action of Polkadot, analyzing key levels of interest in the market. -FXStreet Team


Information on these pages contains forward-looking statements that involve risks and uncertainties. Markets and instruments profiled on this page are for informational purposes only and should not in any way come across as a recommendation to buy or sell in these assets. You should do your own thorough research before making any investment decisions. FXStreet does not in any way guarantee that this information is free from mistakes, errors, or material misstatements. It also does not guarantee that this information is of a timely nature. Investing in Open Markets involves a great deal of risk, including the loss of all or a portion of your investment, as well as emotional distress. All risks, losses and costs associated with investing, including total loss of principal, are your responsibility. The views and opinions expressed in this article are those of the authors and do not necessarily reflect the official policy or position of FXStreet nor its advertisers. The author will not be held responsible for information that is found at the end of links posted on this page.

If not otherwise explicitly mentioned in the body of the article, at the time of writing, the author has no position in any stock mentioned in this article and no business relationship with any company mentioned. The author has not received compensation for writing this article, other than from FXStreet.

FXStreet and the author do not provide personalized recommendations. The author makes no representations as to the accuracy, completeness, or suitability of this information. FXStreet and the author will not be liable for any errors, omissions or any losses, injuries or damages arising from this information and its display or use. Errors and omissions excepted.

The author and FXStreet are not registered investment advisors and nothing in this article is intended to be investment advice.

Join Telegram

Recommended content


Recommended Content

Editors’ Picks

SEC doubles down on TRON's Justin Sun lawsuit dismissing claims over jurisdiction

SEC doubles down on TRON's Justin Sun lawsuit dismissing claims over jurisdiction

The SEC says it has jurisdiction to bring Justin Sun to court as he traveled extensively to the US. Sun asked to dismiss the suit, arguing that the SEC was targeting actions taken outside the US.

More TRON News

XRP fails to break past $0.50, posting 20% weekly losses

XRP fails to break past $0.50, posting 20% weekly losses

XRP trades range-bound below $0.50 for a sixth consecutive day, accumulating 20% losses in the last seven days. Ripple is expected to file its response to the SEC’s remedies-related opening brief by April 22. 

More Ripple News

ImmutableX extends recovery despite $69 million IMX token unlock

ImmutableX extends recovery despite $69 million IMX token unlock

ImmutableX unlocked 34.19 million IMX tokens worth over $69 million early on Friday. IMX circulating supply increased over 2% following the unlock. The Layer 2 blockchain token’s price added nearly 3% to its value on April 19. 

More Cryptocurrencies News

Bitcoin Weekly Forecast: BTC post-halving rally could be partially priced in Premium

Bitcoin Weekly Forecast: BTC post-halving rally could be partially priced in

Bitcoin price briefly slipped below the $60,000 level for the last three days, attracting buyers in this area as the fourth BTC halving is due in a few hours. Is the halving priced in for Bitcoin? Or will the pioneer crypto note more gains in the coming days? 

More Bitcoin News

Bitcoin: BTC post-halving rally could be partially priced in Premium

Bitcoin: BTC post-halving rally could be partially priced in

Bitcoin (BTC) price briefly slipped below the $60,000 level for the last three days, attracting buyers in this area as the fourth BTC halving is due in a few hours. Is the halving priced in for Bitcoin? Or will the pioneer crypto note more gains in the coming days? 

Read full analysis

BTC

ETH

XRP